Dr. Stiefenhofer presented "Transitioning to University: Teaching Statistics to Economics Students" at the INERME workshop, Mathematics in the Transition to University, on October 16, 2024. He emphasized using Shiny apps to promote interactive learning and reduce math anxiety, aiding students in understanding complex statistical concepts and easing their transition to university. The full paper was published in the journal Creative Education in 2022.
Transition to University
The first-year university experience is crucial for students and institutions, impacting satisfaction, retention, and success (Schütze et al., 2021). Yet A-levels often fail to prepare students adequately for the demands of higher education (Roberts & Higgins, 1992). With a more diverse student population (Larsen et al., 2021), universities are responsible for aiding the transition (Nel et al., 2009). While many adapt well, 20%-30% struggle with academic and personal challenges, finding the shift disorienting (Lowe & Cook, 2003). This difficulty can increase psychological distress, affecting confidence and competence (Christie et al., 2006).
To boost retention, universities offer tailored interventions focusing on engagement, academic support, and social connections, fostering belonging (Meehan & Howells, 2018). Studies recommend a holistic approach, integrating academic readiness with affective elements like self-efficacy and resilience (Larsen et al., 2021). Traditionally, these programs use in-person mentoring (McWilliams & Allan, 2014), but the COVID-19 shift to remote learning has posed new challenges.
During the pandemic, universities faced abrupt closures and emergency remote teaching, catching both students and staff unprepared (Kyne & Thompson, 2020). Despite pre-existing research on online learning (Mills & Raju, 2011), the swift shift was especially tough for science and tech courses (Jayalath et al., 2020), due to insufficient digital skills and disorganized materials (Johnson et al., 2009).
Compounding this, social science students often struggle with low motivation in statistics. About 75% experience statistics anxiety, which impedes their performance (Kinkead et al., 2016; Onwuegbuzie & Wilson, 2003). Positive attitudes towards statistics are linked to improved outcomes, particularly in online settings (Liu & Yuan, 2021).
To address these issues, we propose human-machine-based strategies using Interactive Learning Documents to reduce anxiety and enhance performance, drawing on SATS-36 survey dimensions and online system anxiety factors (Schau et al., 1995; Liu & Yuan, 2021). Similar active learning methods have shown success in reducing anxiety and boosting engagement (Rapp-McCall & Anyikwa, 2016; Einbinder, 2014).
Technology Enhanced Learning: R-Shiny-Apps
Research on R-Markdown as a learning tool in statistics is limited but promising. Bray, Çetinkaya-Rundel, and Stangl (2014) emphasize its dual capacity to assess reasoning and outcomes in statistical analysis, while Baumer et al. (2014) demonstrate its utility for creating reproducible analyses in introductory courses. Finch et al. (2021) report that 89% of students with little prior R experience found it beneficial for learning.
Figure 1: Mobile phone interface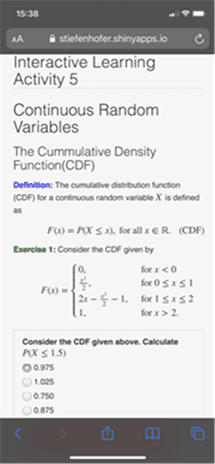
R-Shiny applications also prove effective in statistics education, particularly for easing the transition to university and reducing math anxiety (Stiefenhofer et al. 2022). Doi et al. (2016) used R-Shiny for interactive demonstrations, and Williams and Williams (2018) developed an app to simplify complex concepts like confidence intervals. Gonzalez et al. (2018) offered recommendations for refining these apps based on student feedback.
This paper combines R-Markdown with R-Shiny via the "learnr" package, embedding interactive elements within RMD files and distributing them as HTML documents through shinyapps.io to aid economics students in learning statistics.
Adopting a constructivist approach, where students co-create knowledge through human-machine interactions shaped by their experiences (Kratochwill et al., 1999), we explore integrating this model into remote teaching. Constructivism, effective in science education (Duit, 1996; Mvududu, 2005), aligns with active learning strategies proven successful in traditional settings (Bonwell & Eison, 1991). Our interactive documents aim to make complex concepts more accessible and less daunting in a remote environment.
Figure 2: Organization of Learning Content by Embedding Lecture Slides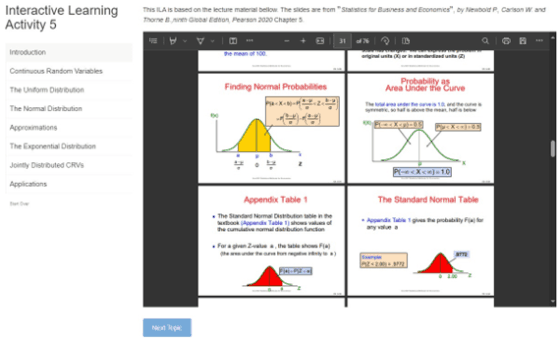
Figure 3: Organizing Learning Content Effectively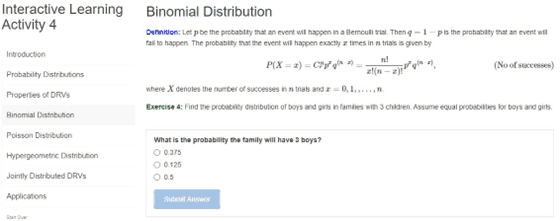
Shiny apps are a powerful tool for organizing learning content for statistics courses by providing an interactive and dynamic platform. They allow students to explore statistical concepts hands-on by manipulating data and variables in real-time, which enhances understanding and engagement. With customizable features, instructors can tailor the content to specific topics, while the instant feedback students receive helps reinforce learning. Additionally, Shiny apps are accessible across devices, making them a flexible option for both classroom use and independent study, ultimately creating an engaging and effective learning experience.
Figure 4: Quizzes with Solutions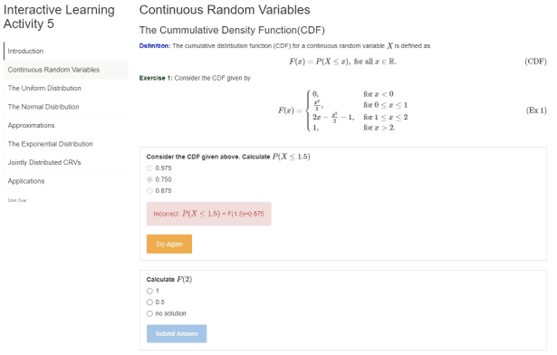
Shiny apps can incorporate quizzes to check students' comprehension of the material, providing immediate feedback and reinforcing learning. This combination of interactivity and assessment makes Shiny apps an effective and engaging tool for teaching statistics. Model solutions can be provided, if answers are incorrect.
Figure 5: Coding Boxes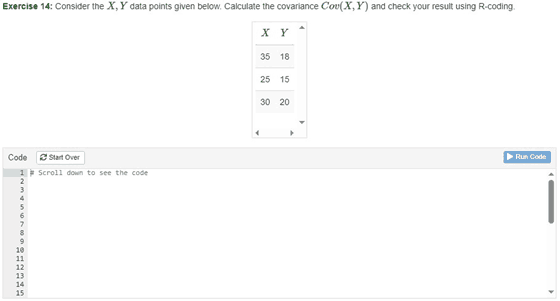
Coding boxes in Shiny apps are a highly useful tool for providing solutions to exercises, such as plotting graphs or performing numerical calculations. By allowing students to write and run code directly within the app, they can actively engage with statistical problems and immediately see the results of their work. This hands-on approach helps them understand the practical application of statistical methods, whether it’s visualizing data through plots or performing complex calculations. Coding boxes thus make it easier for students to experiment, learn from mistakes, and deepen their problem-solving skills in a guided, interactive environment.
Figure 6: Visualizations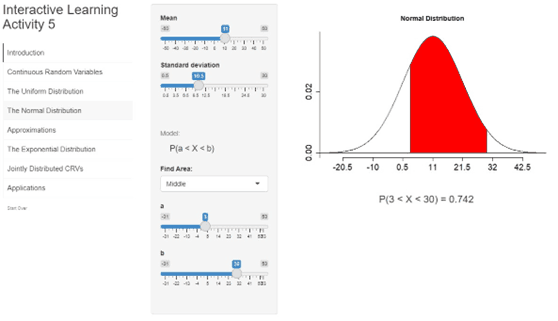
Dynamic interactions with visualizations in Shiny apps significantly enhance the learning experience for statistics students. These interactive features allow students to manipulate data, adjust parameters, and observe how changes impact results in real-time. Whether it's modifying values to see how a distribution shifts or interacting with data points on a graph, dynamic visualizations make abstract statistical concepts more concrete. This hands-on exploration fosters deeper understanding and engagement, as students can directly experiment with and visualize the effects of different statistical techniques, making the learning process more intuitive and impactful.
Figure 7: Dynamic Interaction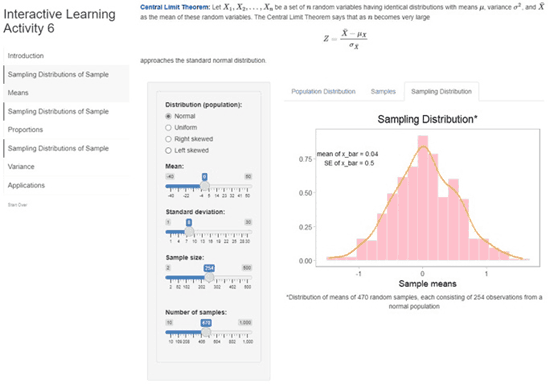
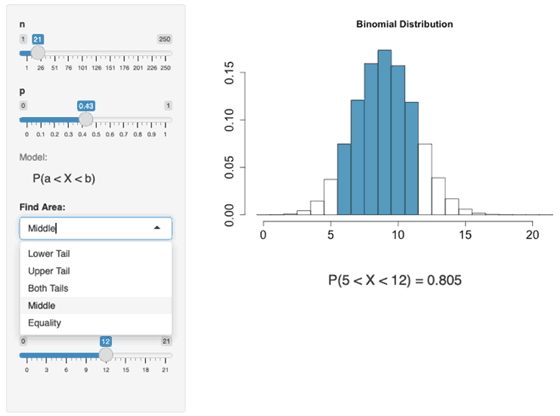
Figure 8: Dynamic Interaction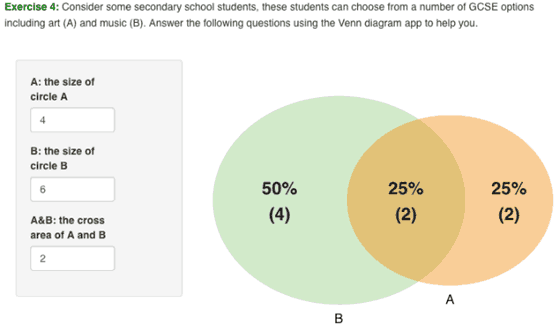
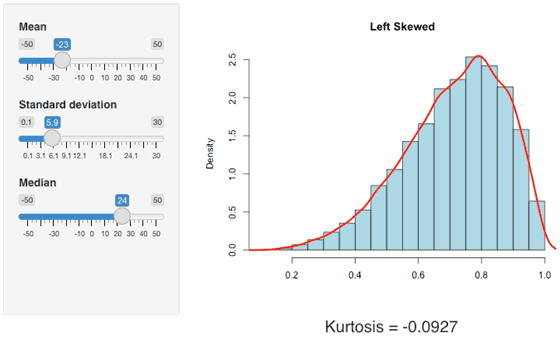
When combined with quizzes, exercises, and practical applications, the dynamic interaction provided by Shiny apps greatly reinforces learning. Quizzes offer immediate feedback, helping students assess their understanding of concepts, while coding exercises and applications encourage hands-on problem-solving. Together, these elements transform learning from passive absorption to active engagement, allowing students to apply statistical theories in real-time, test their knowledge, and refine their skills through practice. This comprehensive, interactive approach deepens understanding and retention of complex statistical concepts, far surpassing the static nature of traditional textbooks.
Figure 9: Data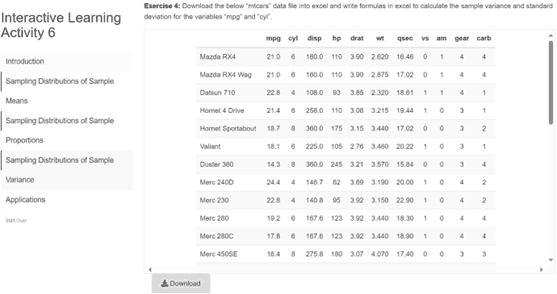
Shiny apps offer a comprehensive platform for working with data, allowing students not only to interact with and analyze data in various ways but also to inspect and download it for further use. Students can explore data through visualizations, perform transformations, and apply statistical analyses directly within the app. In addition, they can inspect raw or processed data tables to gain deeper insights and even download the data sets for offline study or additional analysis. This functionality enhances practical learning, providing a seamless integration of theory, analysis, and real-world data handling.
Figure 10: Video Solutions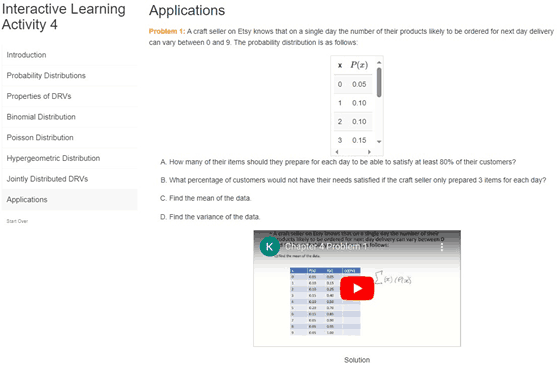
Shiny apps can also incorporate real-world applications that are analyzed through video solutions, where a tutor works through problems step by step at a pace that mirrors how a human would approach them. These video explanations provide students with clear, guided instruction, allowing them to follow along in real-time and see how statistical methods are applied in practical scenarios. By combining this human-paced explanation with the interactive tools of Shiny apps, students can pause, reflect, and experiment with their own solutions, enhancing their understanding and ability to apply statistical concepts to real-world data analysis.
Figure 11: Embedding PDFs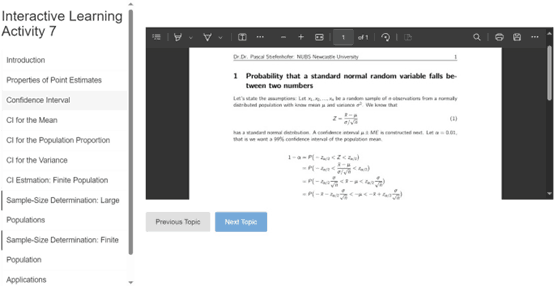
Embedding PDFs within Shiny apps adds significant value by offering students access to additional learning materials, such as detailed notes, research papers, or problem sets. This integration allows students to seamlessly reference key concepts, formulas, or theorems while interacting with the app's dynamic features. For example, a PDF of lecture slides can be embedded next to an interactive graph, enabling students to consult theoretical explanations while experimenting with data. Similarly, embedding research articles alongside exercises helps students see how statistical methods are applied in academic work, bridging the gap between theory and practice. This combination of interactive tools and static resources enriches the learning experience.
The Student Learning Experience
The feedback from students highlights several positive aspects of the ILD. Most students find it easy to use (q4) and appreciate how it helps them stay engaged with their homework (q5), which indicates that the ILD effectively supports active learning. Additionally, many students find it visually appealing (q7), and they agree that it is easy to navigate(q8), making it user-friendly overall. However, when it comes to the “fun to use” factor (q6), responses were less enthusiastic.
Figure 12: ILD Usability
Figure 13: ILD Features
Bar plot (a, q9) shows that some students find limited value in using pre-written R code for checking their exercise solutions. In contrast, scrollable embedded PDFs with detailed mathematical derivations, proofs, and solutions are highly valued (b, q10). Bar plot (c, q11) highlights a strong preference for interactive visualizations that allow parameter adjustments. Notably, none of these features received negative feedback from students.
Figure 14: ILD Features
Students expressed positive feedback on several key features. Regarding Q12, using pre-written R code to check solutions was appreciated for its efficiency and ability to reinforce coding skills while ensuring solution accuracy. For Q13, the embedded PDF files with detailed worked-out examples were highly valued, as they provide clear, step-by-step explanations that help students grasp complex problems and mathematical proofs more easily. Q14 highlighted the popularity of Interactive Dynamic Visualisations, where students can choose parameters, offering a hands-on and intuitive way to engage with and explore statistical concepts.
Figure 15: ILD Features
Bar plot (a, q15) indicates that most students enjoy the ILD’s applications section, which features real-world problems with step-by-step video solutions using tools like PowerPoint, Excel, and a whiteboard. A smaller group strongly prefers this feature, with a few indifferent. Bar plot (b, q16) shows that around half of the students find limited value in the code boxes for checking answers. Bar plot (c, q17) reveals that nearly 83% of students favour this feature, while 17% remain indifferent.
Figure 16: Student Feelings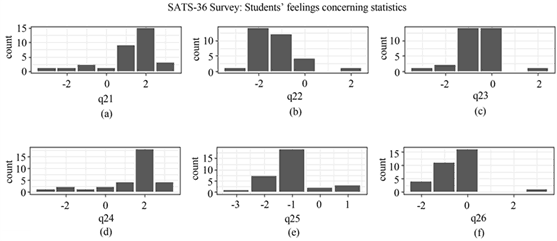
Bar plot (a, q21) shows that 84.4% of students report increased enjoyment of statistics with ILDs, and bar plot (d, q24) indicates a more positive attitude towards taking statistics courses. Bar plot (b, q22) reveals that 85% experience reduced math anxiety, while 15% report no or no negative impact. Although ILDs help reduce fear of statistics, their effect on stress and frustration is weaker: 53% feel ILDs don’t lower class stress (f, q26), and 47% say ILDs don’t ease frustration during test reviews (c, q23).
Figure 17: Learning Effects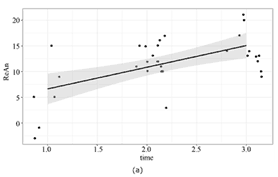
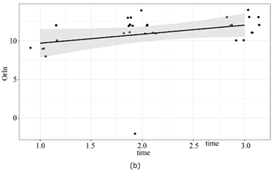
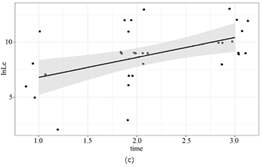
Plot (a) shows that students who spend more time learning with Interactive Learning Documents tend to experience a greater reduction in statistics anxiety compared to those using traditional methods. The strong positive relationship suggests that ILDs are particularly effective for alleviating anxiety. Plot (b) suggests that students who engage more with ILDs benefit from better organization of complex learning material, though the effect is not as strong or significant. In Plot (c), there is a clear positive link between time spent with ILDs and reduced anxiety, highlighting the importance of interactive learning in easing students' concerns about statistics.
Conclusion
The study suggests that ILDs were an effective tool for engaging students in a human-machine interaction-based pedagogy for students transitioning to university during the remote teaching period caused by the global health pandemic. ILDs contributed to student satisfaction and retention in an elementary statistics course, helping ease the transition to university. The ILD-based approach proved effective by organizing large amounts of material using R-Markdown and R-Shiny technologies and promoting active learning through dynamic interactions. Additionally, ILDs helped reduce students' statistics anxiety, addressing key challenges in Emergency Remote Teaching (ERT). While ILDs are not designed to replace intervention programs, they can support them, particularly in blended learning environments. However, pre-written code in the ILDs was less effective for students in this context, suggesting it may be more useful in modules that require coding. Suppressing code visibility and providing a simple "run code" button could enhance the experience, especially for mobile users.
References
Baumer, B., Cetinkaya-Rundel, M., Bray, A., Loi, L., & Horton, N. J. (2014). R Markdown: Integrating a Reproducible Analysis Tool into Introductory Statistics. Technology Innovations in Statistics Education, 8.
https://doi.org/10.5070/T581020118
Bonwell, C. C., & Eison, J. A. (1991). Active Learning: Creating Excitement in the Classroom. ERIC Publications.
Bray, A., Cetinkaya-Rundel, M., & Stangl, D. (2014). Taking a Chance in the Classroom: Five Concrete Reasons Your Students Should Be Learning to Analyze Data in the Reproducible Paradigm. Chance (New York), 27, 53-56.
https://doi.org/10.1080/09332480.2014.965635
Christie, H., Cree, V. E., Hounsell, J., McCune, V., & Tett, L. (2006). From College to University: Looking Backwards, Looking Forwards. Research in Post-Compulsory Education, 11, 351-365.
https://doi.org/10.1080/13596740600916591
Doi, J. (2016). Web Application Teaching Tools for Statistics Using R and Shiny. Technology Innovations in Statistics Education, 9, 1-32.
https://doi.org/10.5070/T591027492
Duit, R. (1996). The Constructivist View in Science Education—What It Has to Offer and What Should Not Be Expected. Investigacoes em Ensino de Ciências, 1, 40-75.
Einbinder, S. D. (2014). Reducing Research Anxiety among MSW Students. Journal of Teaching in Social Work, 34, 2-16.
https://doi.org/10.1080/08841233.2013.863263
Finch, S., Gordon, I., & Patrick, C. (2021). Taking the aRghhhh Out of Teaching Statistics with R: Using R Markdown. Teaching Statistics, 43, S143-S147.
https://doi.org/10.1111/test.12251
González, J. A., López, M., Cobo, E., & Cortés, J. (2018). Assessing Shiny Apps through Student Feedback: Recommendations from a Qualitative Study. Computer Applications in Engineering Education, 26, 1813-1824.
https://doi.org/10.1002/cae.21932
Jayalath, C., Wickramasinghe, U., Kottage, H., & Somaratna, G. (2020). Factors Influencing Orderly Transition to Online Deliveries during COVID19 Pandemic Impact. Asian Journal of Education and Social Studies, 9, 10-24.
https://doi.org/10.9734/ajess/2020/v9i230242
Johnson, H. D., Dasgupta, N., Zhang, H., & Evans, M. A. (2009). Internet Approach versus Lecture and Lab-Based Approach for Teaching an Introductory Statistical Methods Course: Students’ Opinions. Teaching Statistics, 31, 21-26.
https://doi.org/10.1111/j.1467-9639.2009.00335.x
Kinkead, K. J., Miller, H., & Hammett, R. (2016). Adult Perceptions of In-Class Collaborative Problem Solving as Mitigation for Statistics Anxiety. The Journal of Continuing Higher Education, 64, 101-111.
https://doi.org/10.1080/07377363.2016.1178057
Kratochwill, T. R., Littlefield Cook, J., Travers, J. F., & Elliott, S. N. (1999). Educational Psychology: Effective Teaching, Effective Learning (3rd ed.). McGraw-Hill College.
Kyne, S. H., & Thompson, C. D. (2020). The COVID Cohort: Student Transition to University in the Face of a Global Pandemic. Journal of Chemical Education, 97, 3381-3385.
https://doi.org/10.1021/acs.jchemed.0c00769
Larsen, A., Cox, S., Bridge, C., Horvath, D., Emmerling, M., & Abrahams, C. (2021). Short, Multi-Modal, Pre-Commencement Transition Programs for a Diverse STEM Cohort. Journal of University Teaching and Learning Practice, 18, Article 5.
https://doi.org/10.53761/1.18.3.5
Liu, M., & Yuan, R. (2021). Changes in and Effects of Foreign Language Classroom Anxiety and Listening Anxiety on Chinese Undergraduate Students’ English Proficiency in the COVID-19 Context. Frontiers in Psychology, 12, Article ID: 670824.
https://doi.org/10.3389/fpsyg.2021.670824
Lowe, H., & Cook, A. (2003). Mind the Gap: Are Students Prepared for Higher Education? Journal of Further and Higher Education, 27, 53-76.
https://doi.org/10.1080/03098770305629
McWilliams, R., & Allan, Q. (2014). Embedding Academic Literacy Skills: Towards a Best Practice Model. Journal of University Teaching and Learning Practice, 11, Article 8.
https://doi.org/10.53761/1.11.3.8
Meehan, C., & Howells, K. (2018). “What Really Matters to Freshers?”: Evaluation of First Year Student Experience of Transition into University. Journal of Further and Higher Education, 42, 893-907.
https://doi.org/10.1080/0309877X.2017.1323194
Mills, J. D., & Raju, D. (2011). Teaching Statistics Online: A Decade’s Review of the Literature about What Works. Journal of Statistics Education, 19, 1-28.
https://doi.org/10.1080/10691898.2011.11889613
Mvududu, N. (2005). Constructivism in the Statistics Classroom: From Theory to Practice. Teaching Statistics, 27, 49-54.
https://doi.org/10.1111/j.1467-9639.2005.00208.x
Nel, C., Troskie-de Bruin, C., & Bitzer, E. (2009). Students’ Transition from School to University: Possibilities for a Pre-University Intervention. South African Journal of Higher Education, 23, 974-91.
https://doi.org/10.4314/sajhe.v23i5.48811
Onwuegbuzie, A. J., & Wilson, V. A. (2003). Statistics Anxiety: Nature, Etiology, Antecedents, Effects, & Treatments—A Comprehensive Review of the Literature. Teaching in Higher Education, 8, 195-209.
https://doi.org/10.1080/1356251032000052447
Rapp-McCall, L. A., & Anyikwa, V. (2016). Active Learning Strategies and Instructor Presence in an Online Research Methods Course: Can We Decrease Anxiety and Enhance Knowledge? Advances in Social Work, 17, 1-14.
https://doi.org/10.18060/20871
Roberts, D., & Higgins, T. (1992). Higher Education: The Student Experience—The Findings of a Research Programme into the Views and Experiences of Students in Higher Education. Heist Research.
Schau, C., Stevens, J., Dauphinee, T., & Vecchio, A. D. (1995). The Development and Validation of the Survey of Attitudes toward Statistics. Educational and Psychological Measurement, 55, 868-875.
https://doi.org/10.1177/0013164495055005022
Schütze, H., Bartyn, J., & Tapsell, A. (2021). Increasing Self-Efficacy to Improve the Transition to University: An Australian Case Study. Journal of Further and Higher Education, 45, 845-856.
https://doi.org/10.1080/0309877X.2020.1826034
Stiefenhofer, P. , Xie, L. and Wildish-Jones, K. (2022) Emergency Remote Teaching and Programme Intervention: Towards a Human-Machine Pedagogy Based on Interactive Learning Documents. Creative Education, 13, 3690-3714.
https://doi.org/10.4236/ce.2022.1311234
Williams, I. J., & Williams, K. K. (2018). Using an R Shiny to Enhance the Learning Experience of Confidence Intervals. Teaching Statistics, 40, 24-28.
https://doi.org/10.1111/test.12145

