Teaching economics using thought experiments
Teaching economics to non-economics majors, especially in large groups, can be associated with several challenges. Students may be very different in terms of their academic and skills backgrounds. A cohort may include students who are interested in, and knowledgeable about, Economics along with others who are less interested and are taking the module because it is compulsory (Elliott and Sloman, 2010). Often teaching takes place in large lecture halls with little or no student interaction. Using in-class active learning methods to bring a dose of interactivity may not be effective due to the limitations of large group teaching and students may refuse to participate in activities for fear of being judged by other students. Besides, teaching economics involves the use of theories and quantitative models that non-economics students find overwhelming and frustrating. Some students may even suffer from the effects of “maths anxiety”. Even when teaching is data-driven and based on real world situations, students find it hard to relate to the situations and hence lose interest in the subject.
An effective way of helping students overcome anxiety and the limitations of large-group teaching is to involve them in thought experiments. In this case study, I will discuss an approach that I use when teaching economics to non-economics students. This approach requires student input into data generating process through thought experiments. I post hypothetical scenarios and associated questions on the course page (Moodle) a few days before my lectures. Students read the scenarios and answer questions via a poll before attending the lecture. If polling does not generate enough data by the time of the lecture, I give the students a few minutes to participate in the poll at the beginning of the lecture.
I begin the lecture with the discussion of the thought experiment of the week. I show students their responses in a bar chart during the lecture. Students have a chance to analyse the distribution of their answers and reflect on their answers. I then invite them to tell the class about their choices before revealing the correct answers and/or sharing my answers. In what follows, I discuss the implementation of the method in an applied economics course taught to a cohort of first-year non-economics students.
Demand
The image below is a screenshot of a thought experiment I used in my module on the topics of demand and demand elasticity. Students participated in the experiment by indicating their willingness to pay for a dose of COVID-19 vaccine.

The objectives of this exercise are many-fold with the overarching aim to encourage students to think like economists. First, students learn how data on consumer demand could be collected via surveys and auctions (i.e. on eBay). Second, students realise that demand for a product is based on consumer’s willingness to pay, and it reflects the maximum price consumers afford to pay for a product. Third, students learn to analyse demand data for economic and managerial decision-making. As shown below, I use the response data to draw up a demand schedule which reflects the demand for COVID-19 vaccines. Lastly, I demonstrate how survey data can be used to calculate and assess price elasticity of demand for COVID-19 vaccine.
I use the eBay bidding process as an example of how to determine demand for a product. eBay is a natural marketplace to analyse consumer behaviour and demand. Consumers bid for products based on their valuation of the good which represents the most they would be willing to pay for it. The image below shows the results of the polling (click to expand):
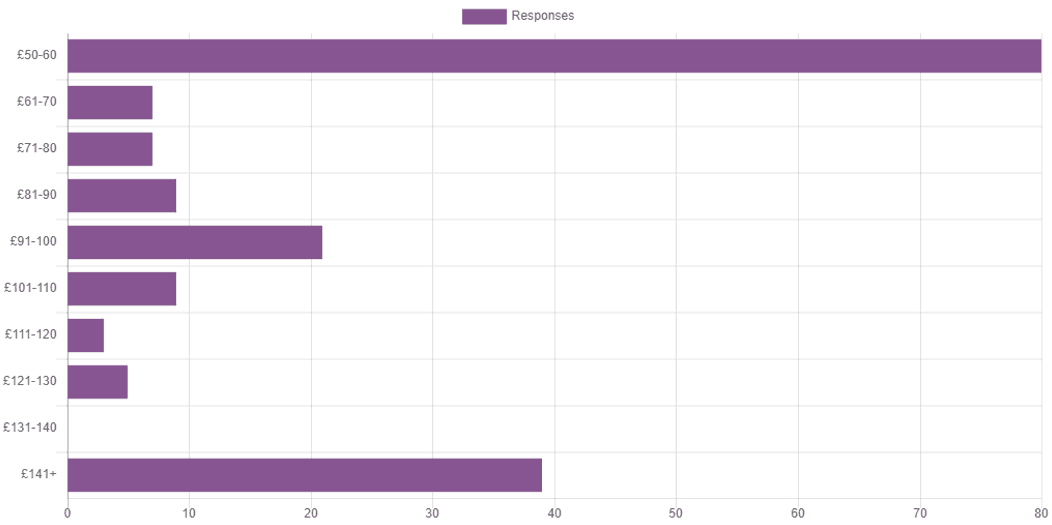
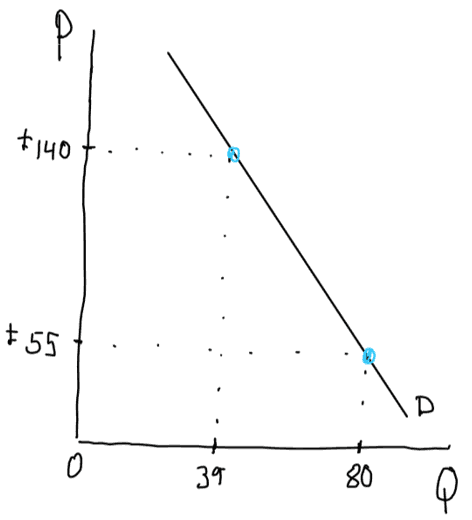
Each student is a potential buyer and has a valuation of a COVID-19 vaccine in light of the circumstances at the onset of the pandemic. Some students were willing to pay more than £140 per jab. Others were willing to spend much less. Bars show the sum of unit demand (by each student) for the vaccine and paint a picture of market demand schedule. The demand schedule can be used to draw a linear demand curve as shown in the image below. Dropping the intermediate points and drawing a linear demand curve through the two end points of the schedule simplifies the analysis. The result is a downward sloping linear market demand curve illustrating that different students have different levels of willingness to pay.
It is possible, and in fact expected of intrigued students, that some students ask questions about the shape of the demand curve if intermediate points were included in the drawing. Instructor may sketch a demand curve through the intermediate points which is concave to the origin. However, to simplify the analysis and to keep consistency with the textbook content, using a linear demand curve is recommended.
Once data is plotted as a linear demand curve, the instructor may draw students’ attention to issues, concepts and theories associated with market demand. The instructor may describe and explain the Law of Demand by highlighting the movements up and down along the demand curve as price and quantity of vaccine change. Next, the instructor might ask students why willingness to pay varies among students along the demand curve. Then, analyse the answers, and help them recognise that the benefits of COVID-19 vaccine are different for different students, and that the demand curve reflects the benefit of the vaccine.
The instructor may introduce factors that shift the demand curve. Here, it is important to encourage students to name non-price factors that may affect their demand for the vaccine. For instance, the instructor asks students about their willingness to pay during and after the pandemic, and how the spread of myths and conspiracy theories might affect the demand for COVID-19 vaccines. As the discussion progresses, instructor draws inward and outward shift of the demand curve in different shades of colour. Next item along the learning curve would then be to discuss the difference between change in (or shift of) demand and movement up and down along the demand curve before moving to supply analysis.
Demand Elasticity
The responses and resulting demand curve can also be utilised to introduce and explain the price elasticity of demand. The instructor may begin by asking students about the slope or steepness of the linear demand curve drawn above. Once students answer the question, it is worth noting that elasticity affects the slope of a good’s demand curve. A greater slope means a steeper demand curve or a less-elastic demand with respect to price. To encourage better student involvement and understanding, the instructor may draw perfectly elastic and perfectly inelastic demand curves on the diagram as reference cases. The reference cases should help struggling students analyse the relative steepness of the demand curve, and hence the elasticity of demand for COVID-19 vaccine. To stimulate discussion, the instructor could illustrate a change in price, and ask if students responded a lot or a little to the change in price. For a benchmark case, the instructor may point out that life-saving medicines command close to perfectly inelastic demand.
As a next step, the instructor may use the price and quantity data from the two end points to estimate the elasticity of demand for COVID-19 vaccine with respect to price. For the above example, I calculated price elasticity of demand using the arc-method as follows:
The discussion can be extended by asking the students about factors that affect the elasticity of demand for COVID-19 vaccine. Students should realise that some of the factors (i.e. income, price of substitutes/complements, etc.) that change (shift) demand also affect the elasticity of demand.
Conclusion
Student participation in thought experiments can be a great way to actively engage them in their own learning as they generate data through their own decisions. My experience has shown that student participation in thought experiments facilitates more active learning than a traditional lecture. It improves learning and engagement, deepens their understanding of economics and boosts their confidence in their abilities to digest theoretical and numerical content, particularly at an introductory level. It encourages students to think like economists and facilitates the application of economic analysis. It is particularly useful in motivating non-economics students to engage with economic concepts and stimulate their interest in economics and helps avoid “maths anxiety”.
Besides the learning and teaching benefits, student participation in thought experiments enables instructors to check in with students, gauge interest, collect feedback, and assess understanding. It helps identify disengaged and drifting students and put them back on the right track. Engagement data collected via thought experiment polling can be used to respond more directly and efficiently to student needs. In my practice, quite often, engagement with learning materials drastically falls after the mid-term assessment. I discuss this with my students at the beginning of the lectures by showing them the engagement statistics. This provides them with an understanding of what they are doing, of where they are at, and of how they can improve going forward.
Bibliography
Elliott and Sloman (2010). "Teaching Economics to Non Economics Majors" The Economics Network. Available at https://economicsnetwork.ac.uk/themes/nonspecialists
Ray, M. (2017) "Teaching economics using ‘cases’– going beyond the ‘chalk-and-talk’ method" International Review of Economics Education, 27, pp. 1-9. https://doi.org/10.1016/j.iree.2017.12.001
Somers, K., Dilendik, J. and Smolansky, B. (1996) "Class Activities with Student-Generated Data" The Mathematics Teacher. 89, 2, pp 105-107. JSTOR 27969654
↑ Top