Replication and Reproduction II: Leybourne et al. (1998) and the Dickey-Fuller test in the presence of breaks under the null
This case study is the second in a set of materials on the effective incorporation of research in undergraduate econometrics edited by Peter Dawson of the University of East Anglia.
1. Introduction
Cook and Watson (2025) argue that replication and reproduction (R&R) provide an active learning environment by immersing learners in the research they read and have recently championed this as a means of incorporating research into the teaching of econometrics. This accompanying case study demonstrates the use of R&R through the work of Leybourne et al. (1998, hereafter referred to as LMN). However, rather than focusing solely on the exact reproduction of the original findings using the authors’ data, it extends the analysis by considering results obtained using a more recent data vintage and a longer sample period. As such, the case study offers learners exposure to the progressive and evolving nature of econometric research while simultaneously developing higher-order skills in critical evaluation, methodological reflection and independent inquiry within an active learning framework.
Following Perron (1989), it has been recognised that structural change can result in the Dickey-Fuller (DF) test (Dickey and Fuller, 1979) failing to reject the unit root null hypothesis for otherwise stationary series. More recently, LMN have shown that structural change can also lead to misclassification in the ‘other direction’: the DF test may spuriously reject the null hypothesis when applied to unit root processes subject to a structural break in either the level or drift. This phenomenon is a key finding in LMN, whose simulation results demonstrate that the extent of size distortion depends on the location, size, and nature (i.e. a break in level or drift) of the structural break.[1]
The impact of a break under the null is illustrated in Tables 1 and 2 of LMN. For level breaks, oversizing is shown to be greatest when the break occurs at the very start of the sample. For drift breaks, however, the maximum distortion occurs when the break occurs early in the sample, but not at the very beginning. For example, LMN report the highest empirical size they detect – 93.6% at the 5% nominal level of significance – when the largest break in drift they consider occurs at observation 16 in a sample of 100 observations.[2] This striking result highlights the severity of the oversizing problem encountered by the DF test under structural change.
To supplement their simulation results, LMN provide an empirical analysis of the natural logarithm of the ratio of real per capita GDP for Denmark and Germany. Using data from Maddison (1995), they consider annual observations for this ratio over the period 1950 to 1994. The series is particularly relevant for their simulation analysis given its apparent break in trend early in the sample. To demonstrate the issue of spurious rejection, LMN show that applying the (augmented) DF (ADF) test to the full 1950-1994 sample leads to overwhelming rejection of the unit root hypothesis, whereas application to a post-break sample (1957-1994) results in non-rejection at conventionally considered levels of significance.
This case study is motivated by LMN’s empirical analysis. While LMN’s results are reproduced, the focus here is on exploring the impact of a more recent vintage of data and extended sample period on the subsequent inferences drawn. Using the updated data, the original analysis is repeated for both the 1950-1994 and 1957-1994 samples, as well as for extended samples covering the period up to 2022. The intention is therefore to move beyond direct reproduction of published research and to expose learners to the progressive and evolving nature of econometric modelling, where findings can be revisited using more recent data and longer sample spans.
To achieve its objectives, this case study proceeds as follows. In Section 2, the results of LMN are reproduced for the 1950-1994 and 1957-1994 samples employed by the authors. We refer to this as the ‘original’ data. In addition to this ‘reproduction’, the findings of LMN are revisited to consider alternative methods for determining the degree of augmentation of the ADF testing equation and their impact upon the inferences drawn. It should be noted that the results presented in this section using the original data are not intended to support a data-based reproduction exercise in class. Learners are not expected to replicate the results themselves given the restricted availability of the data employed. Instead, the material is provided for discussion and comparison with the findings of LMN, with some suggestions offered for its use. In Section 3, we turn to the main focus of the case study: an exploration of the impact of revised data and an extended sample period on the results obtained by LMN. Here, alternative open-source data are employed to generate results that can be compared with those of the original study. Section 4 offers concluding remarks.
2. Using the original data
We begin by considering the empirical analysis of the ratio of per capita GDP for Denmark and Germany presented by LMN. This analysis is based on annual data for the period 1950 to 1994 drawn from Maddison (1995). Using this source, we construct the relevant ratio, referred to here as ‘RATIO’. This series is presented in Figure One below.
Figure One: Plotting the LMN series
It can be seen that Figure One reproduces the plot of the ratio series presented in Leybourne et al. (1998, p.199, Fig. 1). The ADF test is applied to this series following the approach adopted by LMN – specifically, using the sequential t-statistic rule at the 5% level of significance to determine the degree of augmentation, with an intercept and trend term included as deterministic components. This approach produces the results shown in Table One below.[3] These again reproduce the findings reported by LMN, with the unit root hypothesis overwhelmingly rejected at conventionally employed significance levels (the p-value is 0.09%).
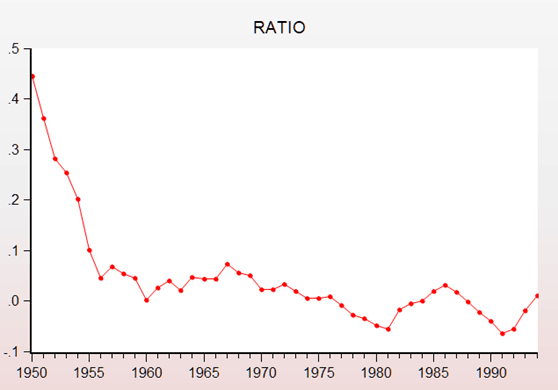
Table One: Reproducing the full sample results in LMN
Null Hypothesis: RATIO has a unit root Exogenous: Constant, Linear Trend Lag Length: 0 (Automatic - based on t-statistic, lagpval=0.05, maxlag=9) | |||
| t-Statistic | Prob.* | ||
| Augmented Dickey-Fuller test statistic | −5.071702 | 0.0009 | |
| Test critical values: | 1% level | −4.180911 | |
| 5% level | −3.515523 | ||
| 10% level | −3.188259 | ||
With a focus on the impact of structural change, LMN continue their analysis by considering alternative break-incorporated unit root tests. In addition, they apply the ADF test to a post-break sample which yields an ADF test statistic of −2.20. Therefore, analysis of this post-break sample leads to non-rejection of the null at conventional significance levels, suggesting that the rejection observed in the full sample analysis may be spurious. Using the Maddison data, the post-break results of LMN can be reproduced, as shown in Table Two.
Table Two: Reproducing the post-break sample results in LMN
Null Hypothesis: RATIO has a unit root Exogenous: Constant, Linear Trend Lag Length: 0 (Automatic - based on t-statistic, lagpval=0.05, maxlag=9) | |||
| t-Statistic | Prob.* | ||
| Augmented Dickey-Fuller test statistic | −2.201191 | 0.4754 | |
| Test critical values: | 1% level | −4.219126 | |
| 5% level | −3.533083 | ||
| 10% level | −3.198312 | ||
The above reproduction of the results of LMN has adopted their exact approach to the application of the ADF test. One subsequent issue to consider is how alternative methods of lag optimisation might affect the results obtained. That is, given the testing equation (1) below, we can examine different approaches to determining the value of ![]() , along with their potential impact on the resulting test statistic and the inferences drawn.
, along with their potential impact on the resulting test statistic and the inferences drawn.
(1) 
In addition to the sequential ![]() -statistic rule at the 5% level of significance employed by LMN, augmentation of the ADF testing equation can be carried out using several other approaches. Commonly employed alternatives include the sequential
-statistic rule at the 5% level of significance employed by LMN, augmentation of the ADF testing equation can be carried out using several other approaches. Commonly employed alternatives include the sequential ![]() -statistic rule at the 10% level of significance[4], the Akaike Information Criterion (AIC), the Schwarz Information Criterion (SIC), and the modified Akaike Information Criterion (MAIC). Results obtained using these alternative approaches for the full sample available are reported in Table Three below, with significance at the 5% and 1% levels indicated by ‘*’ and ‘**’, respectively.
-statistic rule at the 10% level of significance[4], the Akaike Information Criterion (AIC), the Schwarz Information Criterion (SIC), and the modified Akaike Information Criterion (MAIC). Results obtained using these alternative approaches for the full sample available are reported in Table Three below, with significance at the 5% and 1% levels indicated by ‘*’ and ‘**’, respectively.
Table Three: Replication of LMN
| Optimisation Rule | (A)DF test statistic | |
| t-statistic (0.05) | −5.07 ** | 0 |
| t-statistic (0.10) | −2.00 | 6 |
| AIC | −3.80 * | 1 |
| SIC | −3.80 * | 1 |
| MAIC | −5.07 ** | 0 |
It can be seen that while the modified AIC results in selection of the same lag length as the sequential ![]() -test statistic rule at the 5% level of significance – namely, no lagged difference terms – other methods select different lag lengths. The SIC and AIC both choose one lag, while the
-test statistic rule at the 5% level of significance – namely, no lagged difference terms – other methods select different lag lengths. The SIC and AIC both choose one lag, while the ![]() -statistic rule at the 10% level selects six lags. The key finding here is that the use of a longer lag length generates a test statistic that rejects the unit root null hypothesis at conventional significance levels. This highlights how lag augmentation affects the effective sample size used in empirical analysis, raising an issue that supplements standard discussions of lag selection in relation to serial correlation.
-statistic rule at the 10% level selects six lags. The key finding here is that the use of a longer lag length generates a test statistic that rejects the unit root null hypothesis at conventional significance levels. This highlights how lag augmentation affects the effective sample size used in empirical analysis, raising an issue that supplements standard discussions of lag selection in relation to serial correlation.
Given the restricted availability of the original data, the above results are not intended to support a data-based approach to the analysis of LMN– that is, learners are not expected to reproduce these results themselves, as the data are accessible via the Maddison text. Instead, the material is provided to support classroom discussion and to develop understanding in various ways. Here, a range of options is available. The output in Tables One and Two can be related to the test statistics reported in LMN to reinforce understanding of the analysis presented in the paper. Equation (1) can be considered alongside these results, as well as extended output containing complete estimation results for the ADF testing equations, to develop a clearer grasp of the underlying mechanics. Awareness of sample dependence and structural change can be deepened by comparing the plot of the series with the contrasting inferences in Tables One and Two. Table Three can be used to support discussion of alternative lag optimisation techniques and their effects on both inferences and the effective sample size used in estimation.
While these materials can be used in several ways to support discussion of LMN and its insights into unit root testing, the focus of this case study lies in a data-based re-evaluation of LMN’s findings using revised data and an extended sample period. This is the subject of the following section.
3. Using revised data
The empirical findings of LMN can be replicated using a more recent vintage of data. The data employed here are taken from the 2023 Maddison Project Database (Bolt and van Zanden, 2024).[5] These series are not only revised relative to those used by LMN but also extend to 2022, thus allowing consideration of an extended sample period. The required per capita GDP ratio, constructed using these revised data, is labelled ‘NEW_RATIO’ and is presented in Figure Two below.
Figure Two: Revised data
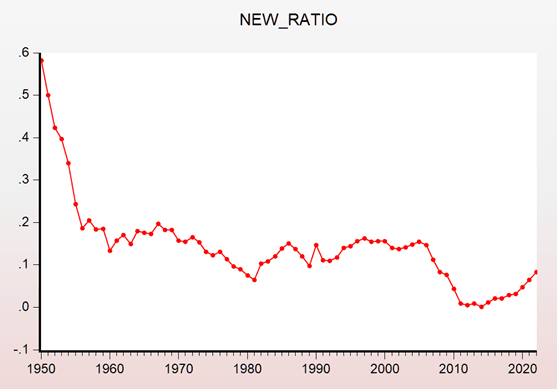
Using the above data, four sets of results can be obtained. To assess the influence of data revision, this later vintage can be used to replicate results over the 1950-1994 and 1957-1994 sample periods originally considered by LMN. In addition, the availability of a longer data series allows for the construction of extended ‘break-including’ and ‘post-break’ samples covering 1950-2022 and 1957-2022, respectively. The results obtained from applying the ADF test to these four samples using the approach followed by LMN towards the specification of the ADF testing equation (i.e. including an intercept and trend as deterministic components and augmentation using the sequential ![]() -statistic rule at the 5% level of significance) are reported in Tables Four to Seven below.
-statistic rule at the 5% level of significance) are reported in Tables Four to Seven below.
Table Four: Replicating LMN with revised data (1950-1994)
Null Hypothesis: RATIO has a unit root Exogenous: Constant, Linear Trend Lag Length: 0 (Automatic - based on t-statistic, lagpval=0.05, maxlag=9) | |||
| t-Statistic | Prob.* | ||
| Augmented Dickey-Fuller test statistic | −4.954714 | 0.0012 | |
| Test critical values: | 1% level | −4.180911 | |
| 5% level | −3.515523 | ||
| 10% level | −3.188259 | ||
Table Five: Replicating LMN with revised data (1957-1994)
Null Hypothesis: RATIO has a unit root Exogenous: Constant, Linear Trend Lag Length: 0 (Automatic - based on t-statistic, lagpval=0.05, maxlag=9) | |||
| t-Statistic | Prob.* | ||
| Augmented Dickey-Fuller test statistic | −2.408953 | 0.3694 | |
| Test critical values: | 1% level | −4.219126 | |
| 5% level | −3.533083 | ||
| 10% level | −3.198312 | ||
Table Six: Replicating LMN with revised data (1950-2022)
Null Hypothesis: RATIO has a unit root Exogenous: Constant, Linear Trend Lag Length: 0 (Automatic - based on t-statistic, lagpval=0.05, maxlag=11) | |||
| t-Statistic | Prob.* | ||
| Augmented Dickey-Fuller test statistic | −5.938186 | 0.0000 | |
| Test critical values: | 1% level | −4.090602 | |
| 5% level | −3.473447 | ||
| 10% level | −3.163967 | ||
Table Seven: Replicating LMN with revised data (1957-2022)
Null Hypothesis: RATIO has a unit root Exogenous: Constant, Linear Trend Lag Length: 0 (Automatic - based on t-statistic, lagpval=0.05, maxlag=10) | |||
| t-Statistic | Prob.* | ||
| Augmented Dickey-Fuller test statistic | −1.944131 | 0.6202 | |
| Test critical values: | 1% level | −4.103198 | |
| 5% level | −3.479367 | ||
| 10% level | −3.167404 | ||
With the updated data, classroom activities can centre on reproducing the results in the four tables and interpreting the inferences. Consequently, discussions can move beyond an initial focus on unit root testing and structural change, as considered by LMN, to explore the implications of data revision (see, inter alia, Cook, 2008; Croushore and Stark, 2003; Egginton et al., 2002; Garratt and Vahey, 2006; Mankiw et al., 1984; Mankiw and Shapiro, 1986; Patterson and Heravi, 1991). This, in turn, enables appreciation of the evolving nature of research, where findings can be revisited and extended through the use of new data or alternative methods.
4. Conclusion
This case study has explored the use of R&R as a means of incorporating research into the teaching of econometrics. Rather than simply duplicating the results of a published article using the original data, the focus here has been on re-evaluating the findings of LMN using new data that are revised and extend over a longer sample period. By adopting this approach, the study creates an active learning framework that exposes learners to the progressive and evolving nature of econometric modelling where findings can be revisited as new data become available. At the same time, the results based on the original data used by LMN are also presented to support classroom discussion in multiple ways. The suggested use of this material reflects a three-part structure that integrates core methodological content (e.g. the structure and mechanics of the approaches considered), lecturer-provided resources, and published research.
References
Bolt, J. and van Zanden, J. 2024. Maddison style estimates of the evolution of the world economy: A new 2023 update. Journal of Economic Surveys 39, 639-659. https://doi.org/10.1111/joes.12618
Cook, S. 2008. Cross-data-vintage encompassing. Oxford Bulletin of Economics and Statistics 70, 849-865. https://doi.org/10.1111/j.1468-0084.2008.00533.x
Cook, S. and Watson, D. 2025. Incorporating research in the teaching of undergraduate econometrics. In The Handbook for Economics Lecturers. Economics Network. https://doi.org/10.53593/m4412a
Croushore, D. and Stark, T. 2003. A real-time data set for macroeconomists: Does the data vintage matter?, Review of Economics and Statistics, 85, 605-617. https://doi.org/10.1162/003465303322369759
Dickey, D. and Fuller, W. 1979. Distribution of the estimators for autoregressive time series with a unit root. Journal of the American Statistical Association 74, 427-431. https://doi.org/10.1080/01621459.1979.10482531
Egginton, D., Pick, A. and Vahey, S. 2002. Keep it real!: A real-time UK macro data set. Economics Letters 77, 15-20. https://doi.org/10.1016/S0165-1765(02)00094-0
Garratt, A. and Vahey, S. 2006. UK real-time macro data characteristics. Economic Journal 116, F119-F135. https://doi.org/10.1111/j.1468-0297.2006.01067.x
Leybourne, S., Mills, T. and Newbold, P. 1998. Spurious rejections by Dickey-Fuller tests in the presence of a break under the null. Journal of Econometrics 87, 191-203. https://doi.org/10.1016/S0304-4076(98)00014-1
Maddison, A. 1995. Monitoring the world economy 1820–1992. Paris: OECD.
Mankiw, G., Runkle, D. and Shapiro, M. 1984. Are preliminary announcements of the money stock rational forecasts? Journal of Monetary Economics 14, 15-27. https://doi.org/10.1016/0304-3932(84)90024-2
Mankiw, G. and Shapiro, M. 1986. News or noise?: An analysis of GDP revisions. Survey of Current Business 66, 20-25.
Ng, S. and Perron, P. 1995. Unit root tests in ARMA models with data-dependent methods for the selection of the truncation lag. Journal of the American Statistical Association 90, 268-281. https://doi.org/10.1080/01621459.1995.10476510
Patterson, K. and Heravi, S. 1991. Data revisions and the expenditure component of GDP. Economic Journal 101, 887-901. https://doi.org/10.2307/2233861
Perron, P. 1989. The Great Crash, the oil price shock, and the unit root hypothesis. Econometrica 57, 1361-1401. https://doi.org/10.2307/1913712
Footnotes
[1] Note that Leybourne et al. (1998) consider a single break which takes the form of either a break in level or break in drift.
[2] The prominent feature of the findings of Leybourne et al. (1998) is the oversizing, or spurious rejection, associated with the DF test when applied to unit root processes subject to structural change ‘early’ in the sample period considered. However, the simulation results provided also demonstrate under-sizing when breaks occur later in the sample.
[3] Note that application of the ADF test results in the use of a testing equation without any lagged differenced regressors- i.e. a DF test.
[4] Ng and Perron (1995) consider the sequential t-statistic rule at both the 5% and 10% levels of significance.
[5] These data are available from https://www.rug.nl/ggdc/historicaldevelopment/maddison/releases/maddison-project-database-2023
↑ Top