Using Excel conditional formulae to provide individual exam feedback in large groups
Abstract
There exists a wide consensus on the importance of assessment feedback for improving the educational outcomes of Higher Education students (Price et al., 2011, Sadler 2010) However, providing feedback is a very time-consuming activity, which is also exacerbated by the fact that individualised feedback is generally preferred by students (Ferguson 2011, Winstone et al., 2015). In this case study, we share our experience of providing question-by-question exam feedback to each of our 220+ students, in the form of automated feedback messages produced using conditional formulae in our Excel mark sheet. Compared to previous years, we find that our mechanism reduces the number of exam clarification requests to negligible levels thus indicating that it aids students in their understanding of their exam grade.
Intervention
The module in which we introduced this intervention is an undergraduate final-year compulsory undergraduate module in the Economics programme at the University of Leeds, namely, Advanced Macroeconomics. We introduced it in two phases during the academic years 21/22 and 22/23 when the module had a cohort size of 240 and 227 respectively.
We used the Excel mark sheet provided by our assessment team as our base file. In this base file, we created extra grade columns for each question and sub-questions included in the exam. Then, linked to each of these grade columns, we created a set of feedback columns. In the feedback columns, we used the marking scheme supplied to the internal and external markers to produce a set of looped conditional formulae - where the grade from grade columns acted as the “logical test” using Excel’s nomenclature - that produced a message if the condition was met, i.e. “value if true”. If the logical test was not passed, we instead added a “value if false”, in our case we added a second condition, or logical test, with a second feedback message for the following possible grade range. We repeated this process until we had a message for all grade ranges that we anticipated for each question. The following example illustrates how we proceeded:
Exam question: 1. Discuss how a negative demand shock can reduce employment equilibrium due to changes in the share of long-term unemployment. What policy recommendations can be drawn from this shock? Illustrate your answer with relevant diagram(s). (30 marks)
The question is split into 3 components - hypothesis, diagram, and policy implications - noted to the internal and external examiners with the following marking scheme:
- Explanation of Layard and Bean hysteresis hypothesis (10 marks)
- Relevant diagrams (5marks) and relevant diagram explanation (5marks)
- Relevant policy implications (10 marks)
- Carlin and Soskice (2006, 2015) optimistic position.
- Ball (1999, 2009) rapid macro policy interventions.
- Blanchard & Summers (1986) hysteresis in reverse.
As a result, we created 4 grade columns, one for each of the 3 sub-question components, and one to sum the 3 sub-question grades (see Columns B-E in Figure 1). Associated to each of the grade components in B-E we created 3 feedback columns (see Columns F-H in Figure 1). In each of the feedback columns, we turned the marking scheme proposed to the internal and external examiners into a conditional formula that provided a suitable feedback message for each grade range that we anticipated we might encounter. For example, in column F, if the grade in B3, corresponding to the explanation of the hypothesis is greater than 6, we set this as our “logical test”, the student was judged to have provided a good answer, the “value if true” attributed to this case was no message, denoted by empty quotation marks “ ”. If the logical test B3>6 was not passed, the “value if false” became the new logical test, in this case B3>4, to which we attributed the following “value if true” or feedback: “Lacks details in explaining the hysteresis hypothesis, see Lecture 7". This was the message received by grades in B3 greater than 4 but smaller than 6. Further, if the logical test B3>4 was not passed, the “value if false” became our last logical test, in this case B3>0, with the “value if true”, i.e. feedback attributed to this range (greater than 0 but smaller than 4) being “Very superficial or no explanation of hysteresis hypothesis, see L7". The conditional formulae with their feedback for the other two components of the question are reported in columns G and H, and can be interpreted in the same way. Using this design, markers simply have to input the grade to automatically generate feedback messages.
Figure 1. Excel Spreadsheet
| A | B | C | D | E | F | G | H | |
|---|---|---|---|---|---|---|---|---|
| 1 | GRADE | GRADE | GRADE | GRADE | FEEDBACK | FEEDBACK | FEEDBACK | |
| 2 | SID | Q1 hypoth. | Q1 Diag | Q1 Pol | Q1 Total | Q1 hypoth. | Q1 Diag | Q1 Pol |
| 3 | =IF(B3>6,"",IF(B3>4,"Lacks details in explaining the hysteresis hypothesis, see L7",IF(B3>0,"Very superficial or no explanation of hysteresis hypothesis, see L7",""))) | =IF(C3>7,"",IF(C3>5,"Lacks details explaining diagram and/or small diagram issues, see L7",IF(C3>0,"Incomplete or incorrect diagram, see L7",""))) | =IF(D3>6,"",IF(D1>4,"Lacks details in explaining policy implications, see L7",IF(D3>0,"Very superficial or no explanation of policy implications, see L7",""))) |
We also used this approach with the exam’s maths questions, for which it was easier to create the different grade ranges and feedback messages, but in the above, we have used one of our small essay questions as an example to illustrate that this is also applicable in non-technical questions.
One of the key advantages of this approach is that it produces individual feedback, in fact, it produces several messages per question for the same student. Though it does require some initial set-up time to create the conditional formulae, these feedback messages are generated automatically once the marker inputs the grade. In particular, since the marking scheme is already prepared for the internal and external examiners this initial cost only amounts to 15-20 minutes. Another advantage is that the marker can also use the conditional formula to direct the student to the lecture/seminar where further guidance to understand their mistake can be found.
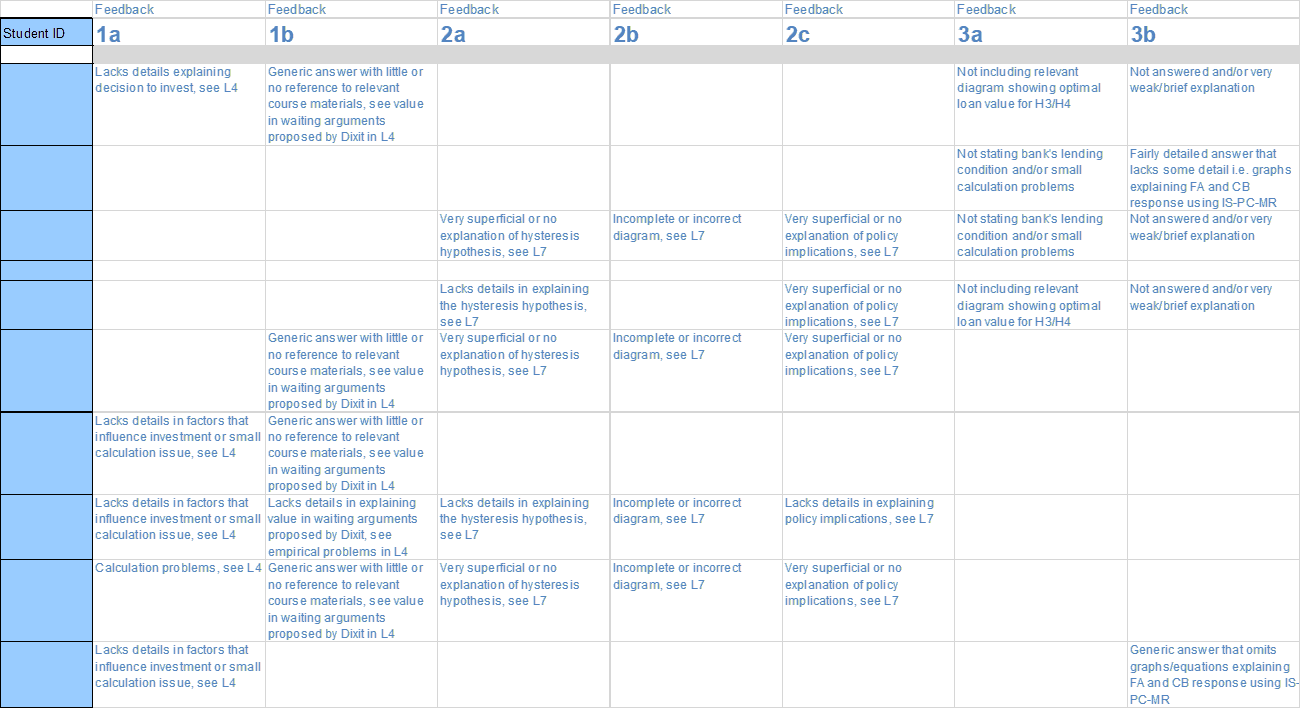
Once marking was completed, we created a second mark sheet were we pasted only Students’ ID and feedback messages. Figure 2 provides a snapshot of this feedback sheet.
Figure 2. Feedback sheet (click to expand)
Students’ response
The intervention was first introduced in the 21/22 academic year, where we provided individual feedback in 2 out of 4 exam questions. In 22/23, we extended it to all questions. Figure 3a below compares the evolution of students’ requests for exam clarification during the intervention years to the preceding academic years 19/20 (pre-pandemic) and 20/21 (1st pandemic year), respectively.
Figure 3. Students’ requests
(a) Across years 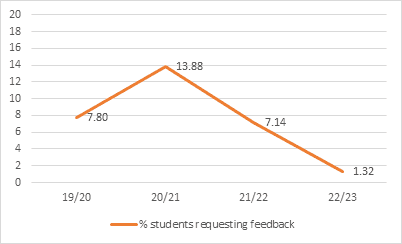
(b) Across questions in 21/22 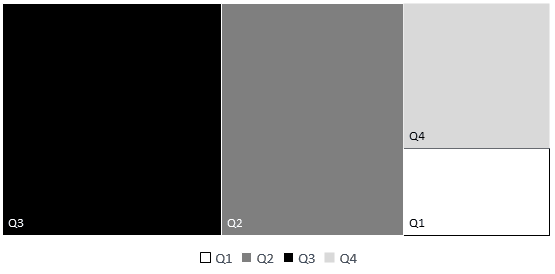
In the first phase of our intervention, in 21/22, when we only provided individual feedback for 2 out of 4 questions, the proportion of student (out of the year cohort) requesting exam clarification fell to half compared to 20/21, from 13.88 to 7.14%. This suggests that the intervention was very successful, although, we do not consider 20/21 a fair comparison, as this was the first academic year under the pandemic and students might have been more willing to scrutinize marking. Indeed, when we compare the percentage of students requesting exam clarification received in 21/22 to 19/20, our pre-pandemic reference, the fall in requests is more modest, from 7.8 to 7.14%. Still indicating that the intervention helps clarify exam grades, but with a modest impact.
In the second phase, in 22/23, when we extended the intervention to all 4-exam questions, the reduction in requests for exam feedback was very marked, as only 1.3% of students requested a clarification of their exams grades. This is about 6 times less than in 19/20 (pre-pandemic) and nearly 10 times lower than in 20/21 (1st pandemic year). Furthermore, considering in more detail the requests for 21/22, Figure 3b shows that, when we only provide individual feedback for question 1 and 4 of the exam, requests concentrated in questions 3 and 2, the two questions without feedback.
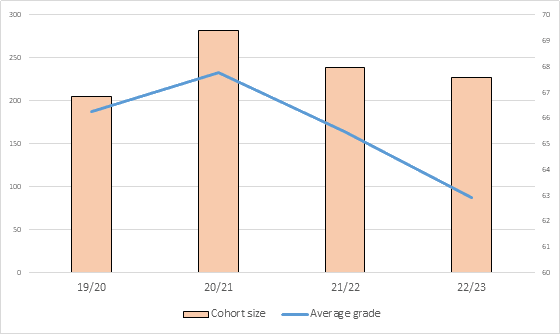
Consequently, we interpret the reduction of requests across years, and the concentration of requests on the questions without feedback in 21/22, as evidence that our intervention significantly helped students to understand their grades. Therefore, given the size of the reduction in students’ requests, we judge our intervention to be very successful. Reinforcing this conclusion, Figure 4 highlights (across stable cohorts of 220+ students) that the reduction in students’ requests in 21/22 and 22/23 coincided with a fall in the average grade in the exam which we would have expected to have triggered an increase in students requests to clarify their grades.
Figure 4. Cohort size and average grade
A balance of cost and benefits
For students, there are no costs, but the benefits are clear, a better understanding of their grades. For staff, the costs are minimal. Preparing the conditional formulae based on the marking scheme sent to the internal and external examiners takes relatively little time, approximately 5-10 minutes per question. This time is compensated with a far greater reduction of the time dedicated to manage students’ requests, requesting the assessment team to retrieve exam papers and meeting students.
We also found, that designing the feedback messages in advanced helped us to focus on the rights and wrongs of the answer, and providing forward feeds, rather than providing messages that justify our grades. Hence, avoiding the problem identified by Winstone and Boud (2020), who noted that in many occasions exam feedback is used to justify grades rather than providing reflective feedback to students.
Summary
To sum up, we find that using conditional formulae in Excel is a very time-effective manner of providing individual exam feedback, even when the class size is large, in our case more than 220 students. More importantly, the intervention seems to meet demand for individual feedback from students, as this has fallen very markedly, a clear sign that our intervention contributes significantly in making exams grades understandable for students.
References
Ferguson, P. 2011. Student perceptions of quality feedback in teacher education. Assessment & Evaluation in Higher Education, vol. 36, no. 1, 51-62. https://doi.org/10.1080/02602930903197883
Price, M., J. Carroll, B. O’Donovan & C. Rust. 2011. If I was going there I wouldn’t start from here: a critical commentary on current assessment practice. Assessment & Evaluation in Higher Education, vol. 36, no. 4, 479-492. https://doi.org/10.1080/02602930903512883
Sadler, D. R. 2010. Beyond feedback: developing student capability in complex appraisal. Assessment & Evaluation in Higher Education, vol. 35, no. 5, 535-550. https://doi.org/10.1080/02602930903541015
Winstone, N. E., R. A. Nash, J. Rowntree & R. Menezes. 2015. What do students want most from written feedback information? Distinguishing necessities from luxuries using a budgeting methodology. Assessment & Evaluation in Higher Education, 1-17. https://doi.org/10.1080/02602938.2015.1075956
Winstone, N. E., & Boud, D. (2020). The need to disentangle assessment and feedback in higher education. Studies in Higher Education, 1-12. https://doi.org/10.1080/03075079.2020.1779687
↑ Top