
Teaching statistics and econometrics through the lens of sustainable development
In 2026, I recorded and published a series of teaching videos entitled Statistics for Sustainable Development. The aim was both to provide supplementary material for my first- and second-year undergraduate statistics and econometrics modules and create a resource that can be used by teachers and students of statistics more widely. At this early stage, evidence for effectiveness is mixed, giving cause for reflection on how to achieve greater impact for student engagement and performance going forward.
The videos can be found here: https://www.youtube.com/@drandrewbryce. With appropriate acknowledgement, you are very welcome to use any of these materials in your own teaching.
Background
I am a university teacher in the School of Economics at the University of Sheffield. For the last two years, I have been teaching core modules in statistics and econometrics. Specifically, I am the module lead for Statistics and Econometrics, a second-year compulsory module for BA dual honours students taking Economics as part of their dual programme. I also teach the second half of the year-long Statistical Methods for Economics module which is compulsory for BA and BSc single honours students in Economics.
After completing my first year of teaching these modules, I reflected with my academic line manager on how my teaching could be developed and improved for the coming year. Student feedback revealed that many students found the subject hard and, in some cases, boring. Performance on the end-of-module exams was very dispersed with several students achieving very high marks and others falling far below the pass mark. Clearly students were struggling with both engagement and understanding. We felt that these shortcomings could potentially be addressed through the medium of video. Many students commented that they learn statistics better and enjoy the subject more when it is taught in an applied rather than an abstract way, using worked examples or real data to explain concepts.
At the same time, the University of Sheffield has been developing its agenda for Education for Sustainable Development (ESD). The goal is for every student at the university, in any discipline, to understand how their subject relates to sustainability, defined by the Sustainable Development Goals (SDGs). ESD will be embedded into all our programmes over the next few years.
It occurred to me that sustainable development is an ideal real-world application for a study in introductory statistics. And that is how Statistics for Sustainable Development was born.
Method
From a technical point of view, the production of the videos was quite straightforward. I used Kaltura Capture to make the videos. This software allows one to record microphone, camera and screen inputs simultaneously. However, I opted not to use the camera but rather to record a PowerPoint presentation with a voiceover. Animation and transition tools within PowerPoint were used to produce dynamic effects and free images were sourced from Pixabay with no copyright restrictions. I created a YouTube channel with my university Google account and published the videos there. At no point was AI used in the creative process.
Working out the content of the videos took more consideration. I wanted the series to be accessible to people with no background in statistics but I also wanted it to be rigorous and complementary to my own teaching. And of course I wanted the content to be related to real-world issues and data, preferably linked to the SDGs. In contrast to many contemporary textbooks that rely heavily on applications from familiar developed economies, I was keen to redress this colonial bias and source data from somewhere completely different.

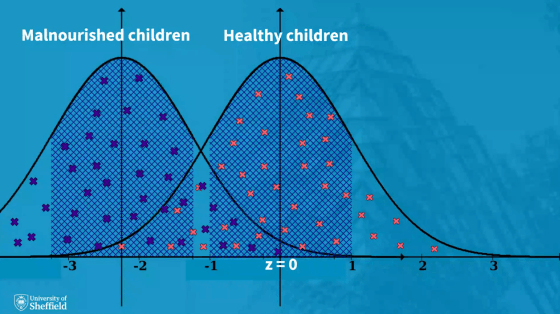
Searching on the UK Data Service website, it did not take me long to discover a teaching dataset from the Young Lives study (University of Essex, 2022). This was a child development study carried out in Ethiopia in the early 2000s. One of the variables contained in this dataset is the height-for-age z-score of the child, otherwise defined as the number of standard deviations the child’s height is away from the height of the median healthy child of the same age. This measure relates directly to a target within SDG2 (zero hunger) to reduce the prevalence of stunting among children under the age of five.
To understand this SDG target, one has to comprehend the concepts of median, standard deviation and normal distribution, so this provided the basis for my first video. I then followed this up with two videos on hypothesis testing and two further videos on correlation and simple regression respectively. The latter two videos focus on the relationship between household wealth and the height-for-age of children.
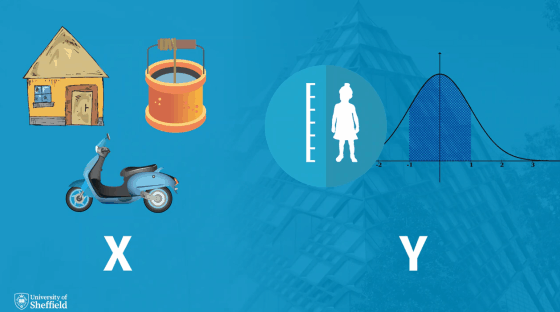
The videos were intentionally short in length with only the last two videos lasting more than ten minutes. As much as possible, I tried to explain concepts using visual or graphical representation but mathematical notation was also used in places to ensure precision and rigour. To aid understanding, I focused on two or three observations from the dataset and even gave the children pseudonyms. By so doing, I was able to tell the stories of individual children in the context of where they fitted into the overall distribution.
The links to all five videos were posted to the Statistical Methods for Economics Blackboard site during the spring semester of 2025-26. Each video was posted alongside the lecture materials covering the same topic. I marked the posts with the university-recognised ESD logo but told students that the videos are supplementary and non-mandatory material. A few weeks before the summer exam, I provided the students with some practice questions which were all based on the Young Lives data.
Outcomes
In the first six months of my YouTube channel being active, I have gained 19 subscribers and my videos have attracted a total of 338 views. No comments have been left. I expect that much of this traffic has originated from my own social media posts announcing the release of videos.
Of more importance is the impact on my own students, and unfortunately the numbers look a little disappointing. From the 263 students registered on the module, an average of 17 students started watching the video and an average of eight students marked the task as complete. The practice exam questions were far more popular, with 152 starts and four completions.
More encouraging was the fact that end-of-module student evaluation scores improved on nearly all categories compared to the previous year. However, the percentage of students giving a favourable response to the statement “This module has encouraged the development of knowledge and skills to promote social, environmental, end economic sustainability” actually fell. None of the free text feedback provided by students (either positive or negative) mentioned the ESD material. Performance on the final exam also fell markedly although this could be attributed to a more difficult assessment.
I conclude from these mixed results not that my efforts have been fruitless but that proper consideration must be given as to how creative ideas and innovations can best be integrated into programmes of study to maximise benefits for students.
Next steps
Over the summer, I plan to extend the video series further as I build up a multiple regression model using the Young Lives data and discuss the extent to which we can infer causality from the results. The aim is to continue to show how statistical methods can be used to understand and address sustainable development issues and thereby motivate students to learn the tools of the trade.
I feel that the series is additional and complementary to the video resources in statistics and econometrics already available on the Economics Network website. These existing resources include Ken Heather’s Videos in Statistics for Social Sciences and Josh Angrist’s Mastering Econometrics. Both are excellent video series to which I have signposted my own students. However, in both cases, the examples used are heavily biased towards the West in a similar vein to most modern textbooks. Moreover, while there are countless teaching videos on statistics and econometrics published on YouTube, it is difficult to find any that explicitly approach the discipline through the lens of sustainable development. I am therefore confident that my contributions add value to what is already available.

Looking forward to the next academic year, the key focus is to improve student engagement with the ESD content on the module. I will explore how to embed ESD into the core curriculum of the modules on which I teach, rather than it being merely an optional extra. The fact that students engaged much more with the practice exam questions than the teaching videos suggests that students are much more likely to access learning materials if they think this will help them with the assessment.
I will also explore ways to evaluate student’s engagement and opinions on the ESD content more directly, by asking them to feed back on the usefulness of this material.
Conclusion
Let’s face it, statistics can be a dry subject. And yet there are very good reasons for insisting that all our students master it. Finding that connection with the global issues that matter, and that our students care about, is surely the key to bringing the discipline to life and delivering the enjoyment and competence that we want our students to experience.
References
University of Essex, UK Data Archive, ESDS International. (2022). Young Lives: Rounds 1 and 2, 2002-2006: Ethiopia: Teaching Dataset. [data collection]. Department for International Development, [original data producer(s)]. Department for International Development. SN: 6563, https://doi.org/10.5255/UKDA-SN-6563-1
↑ Top