Trends in UK economics education (2014 data)
A report in February 2023 continues some statistics from this report
Introduction
This report forms part of the Economics Network’s ongoing research into economics education. It provides a detailed summary of data collected on a range of topics including: student numbers at both A-level and undergraduate level, course entry requirements, student satisfaction with their degree programmes and graduate salaries.
This research aims to inform the discipline on changing numbers and demographics within economics higher education and to highlight any issues that may be of note for departments, for example student dissatisfaction with feedback provision, as shown by the National Student Survey (NSS) data collected for this report.
Pre-University Education Data
- The number of students sitting A-level Mathematics has increased the most dramatically in the last ten years, compared with Economics and Business Studies, although this increase has slowed in recent years.
- The number of students sitting A-level Economics has also increased in the last ten years, particularly from 2008 onwards, which may suggest some impact of the 2008 financial crisis. The long-term increases in Economics, however, are much less dramatic than those in mathematics.
- The number of students sitting A-level Business Studies has fallen over the past ten years and is continuing to fall.
- The proportion of female students studying Economics has remained relatively constant over the past ten years, despite increases in overall student numbers in Economics.
- A higher proportion of A-level students achieved an A* grade in Mathematics than in any other subject.
Percentage changes in A-level students numbers from 2013 to 2014:
All subjects | - 2.0% |
Economics | +1.8% |
Business Studies | -3.4% |
Mathematics | +0.9% |
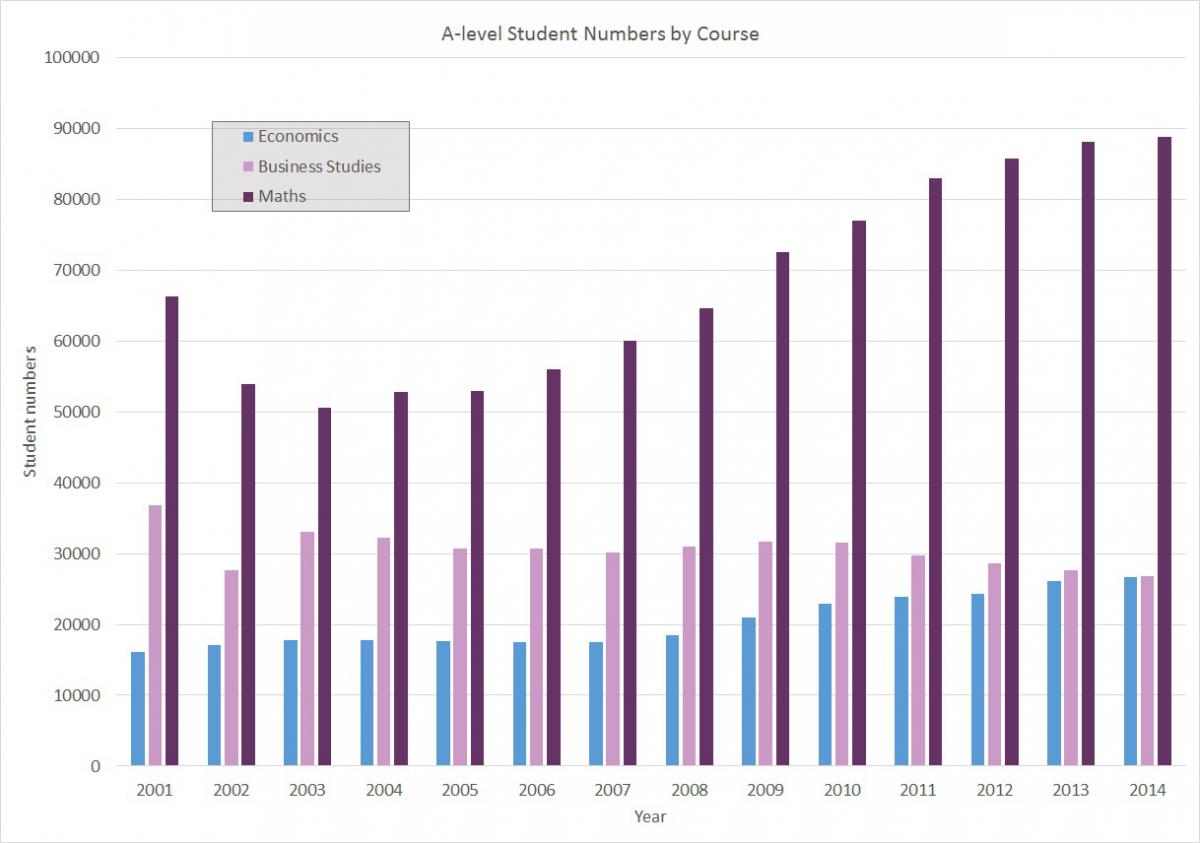
Figure 1 - A-level Student Numbers by Subject - Click to enlarge
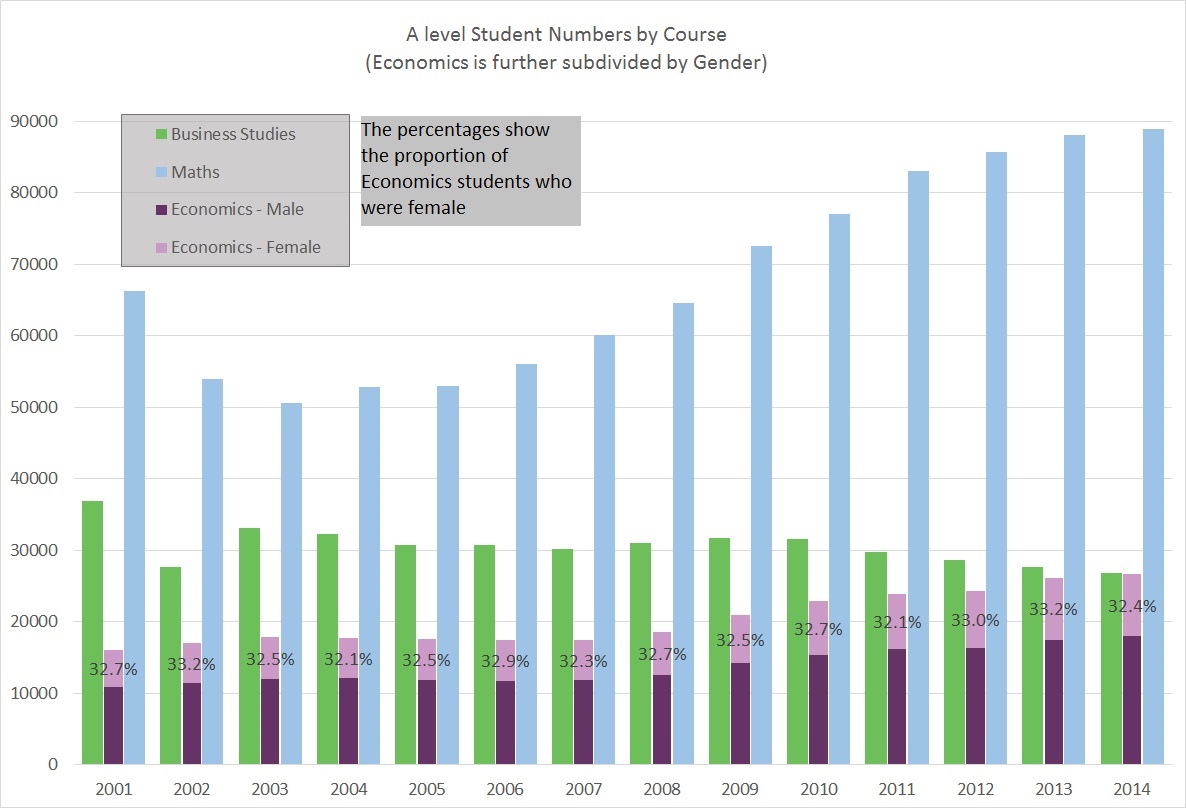
Figure 2 - A-level Student Numbers by Subject with Economics further subdivided by Gender - Click to enlarge

Figure 3 - 2014 A-level Grades bu Subject (as % of total) - Click to enlarge
Source: Data for figures 1, 2 and 3 is taken from the Joint Council for Qualifications website archive (http://www.jcq.org.uk/examination-results/a-levels)
University Application Data
Entry Requirements
- There is a fairly constant number of L100 Economics courses available across UCAS entry tariffs from 280 to 380 points.
- Russell Group universities tend to have the highest minimum entry requirements for L100 Economics courses with post-1992 universities having the lowest minimum entry requirements.
- 13 of the 62 universities found to offer L100 Economics courses for 2016 entry listed A-level Mathematics as a pre-requisite for their course, with 8 of these requiring Grade A or better. One university required an A* grade in A-level Mathematics.
- None of these 62 universities listed A-level Economics as a pre-requisite.
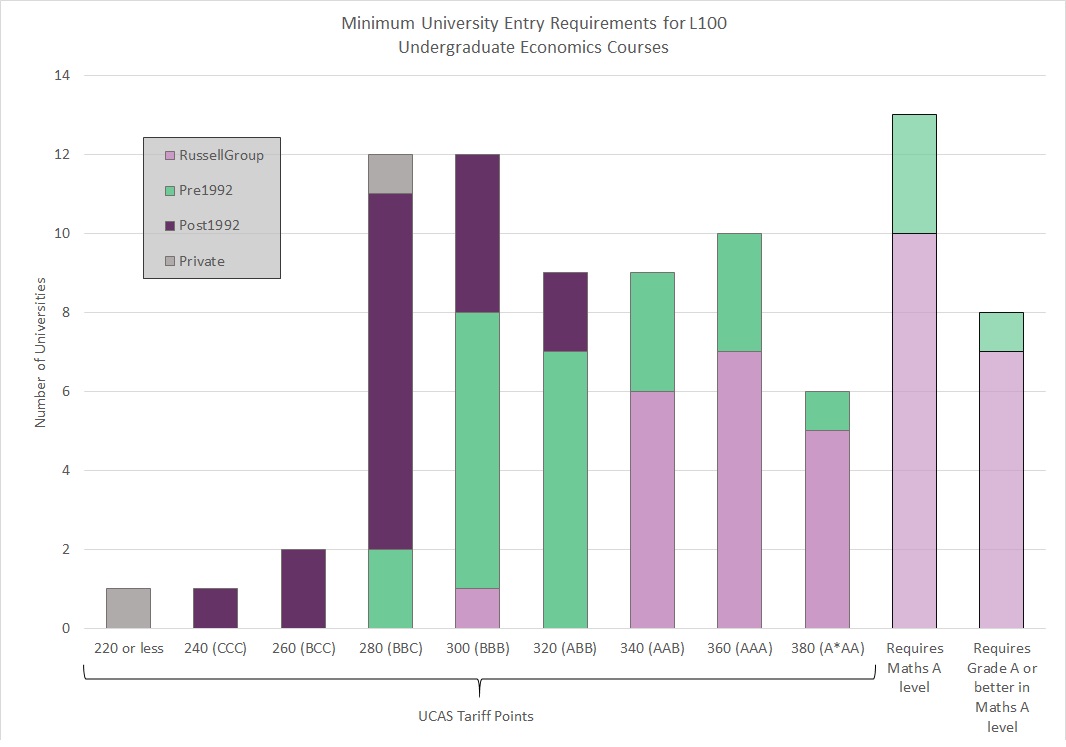 Figure 4 - Minimum University Entry Requirements for L100 Undergraduate Economics Courses for 2016 Entry - Click to enlarge
Source: Data for figure 4 is taken from the UCAS course search and includes the minimum entry requirements for L100 full-time undergraduate courses for entry in 2016.
Application Numbers
- Economics and Mathematics undergraduate courses have seen an increase in applications since 2007.
- Most courses experienced a surge in application numbers before the introduction of the higher tuition fee cap in 2011 which was followed by a dip in application numbers for the first year of these higher fees (in most cases £9000) in 2012. This was most noticeable for Business Studies courses. Finance, however, was an exception to the rule as applications dipped in 2010 and returned to growth in 2011.
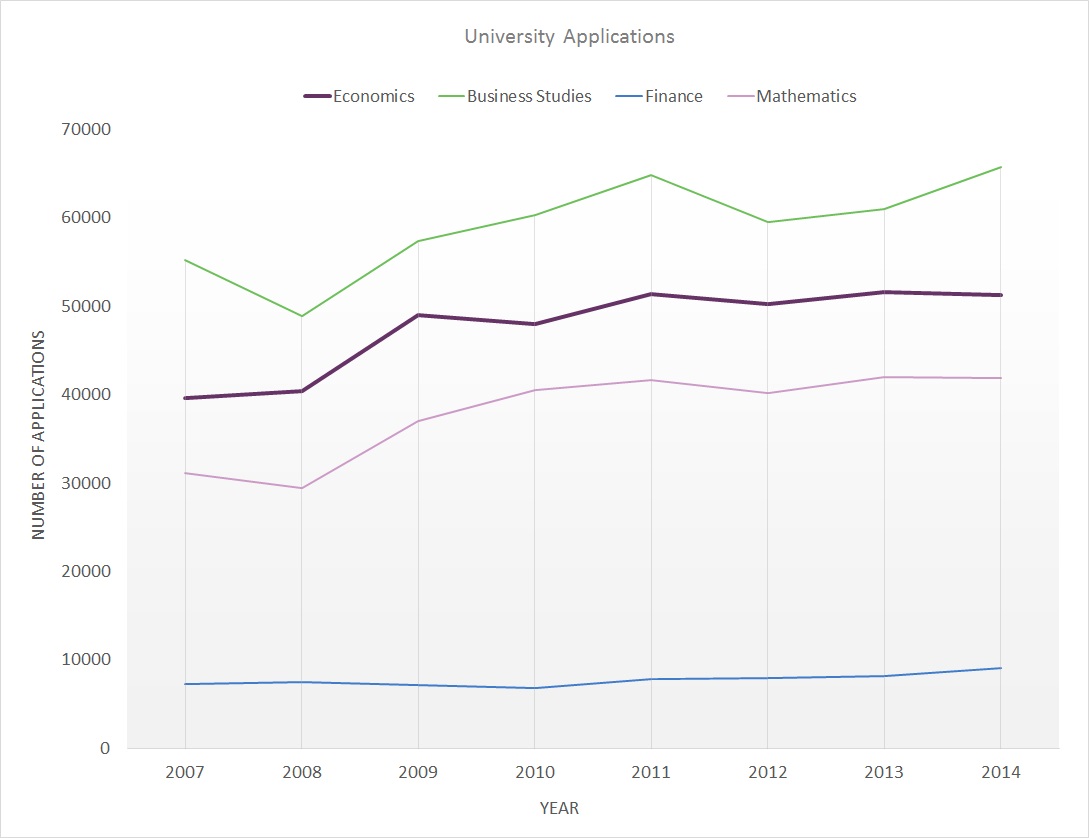 Figure 5 - Number of University Application by Course Over Time - Click to enlarge
Source: Data for figure 5 is taken from the 2014 End of Cycle data release.
The Student Demographic
Gender
- There is still a significant male bias in university-level Economics, with Business Studies and Mathematics also being male dominated, although less so.
- In comparison with the previous point, there is a majority female population in 2014 University Acceptances overall.
- The A-level data shows that there is a similar proportion of female students between both A-level and university-level Mathematics and A-level and university-level Economics.
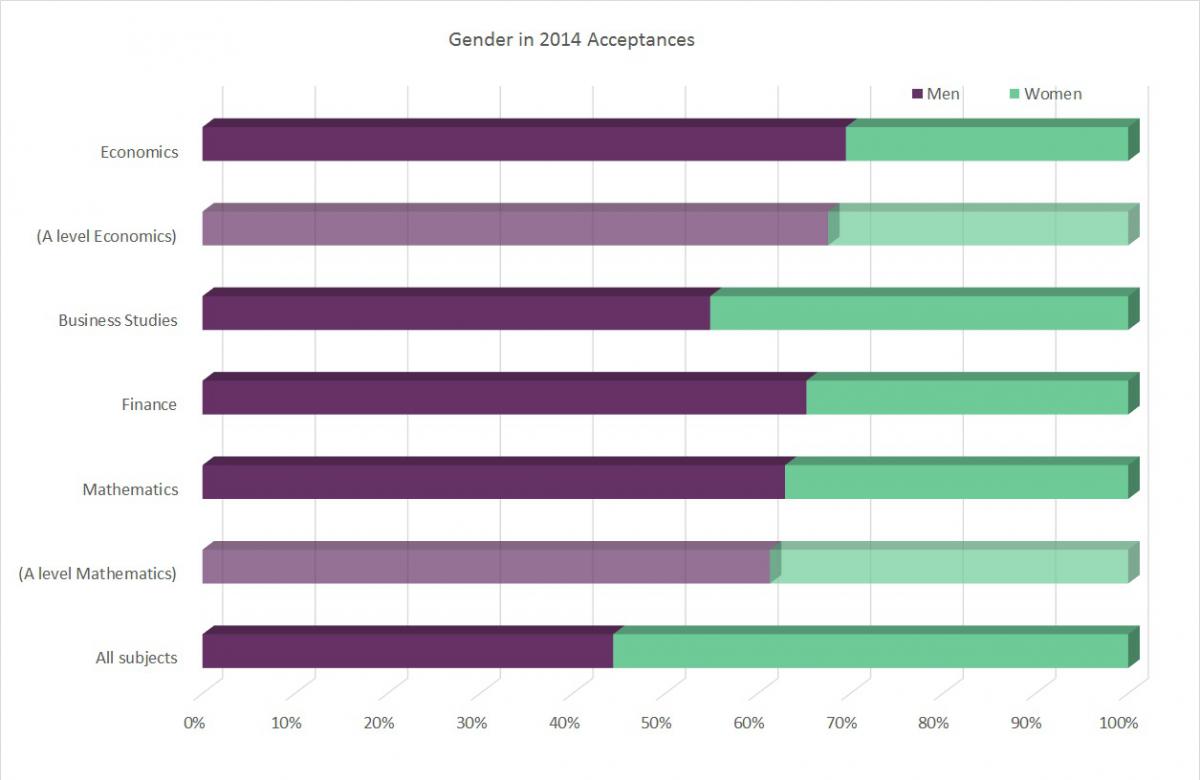
Figure 6 - Gender in 2014 University Acceptances - Click to enlarge
Source: Data for figure 6 is taken from the UCAS 2014 End of Cycle data release with supporting A-level data from the Joint Council for Qualifications.
Area of Permanent Residence
- Economics, Business Studies and Finance courses have a higher proportion of international (non-UK) students than university courses as a whole. This is particularly pronounced for Finance courses.
- The vast majority of Economics students, around 70%, are from the UK.
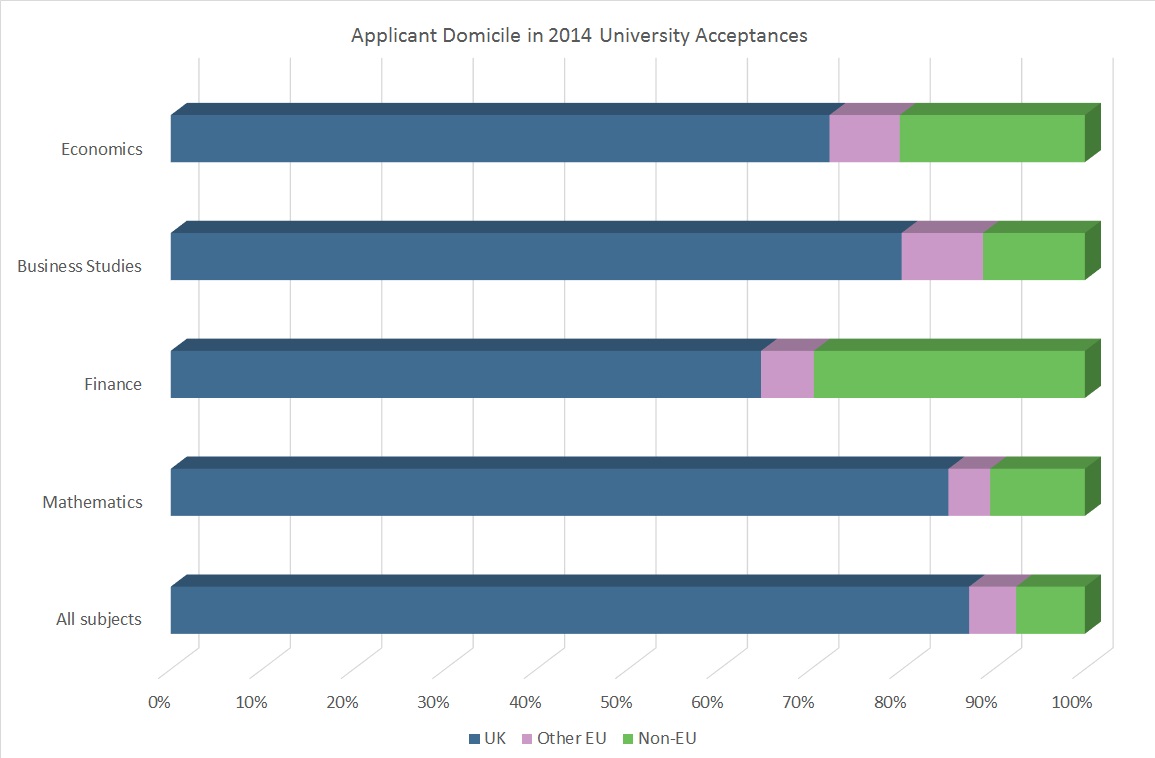
Figure 7 - Applicant Domicile in 2014 University Acceptances - Click to enlarge
Source: Data for figures 7 and 8 is taken from the UCAS 2014 End of Cycle data release.
Age
- Economics acceptances in the 2014 data cycle are slightly younger than the overall sample of 2014 university acceptances with the majority of Economics students being aged 18 or under.
- Those accepted onto Business Studies and Finance courses are generally slightly older than the overall sample with around 25% of those accepted to study Business Studies being aged 21 or over compared to just 6% in Mathematics.
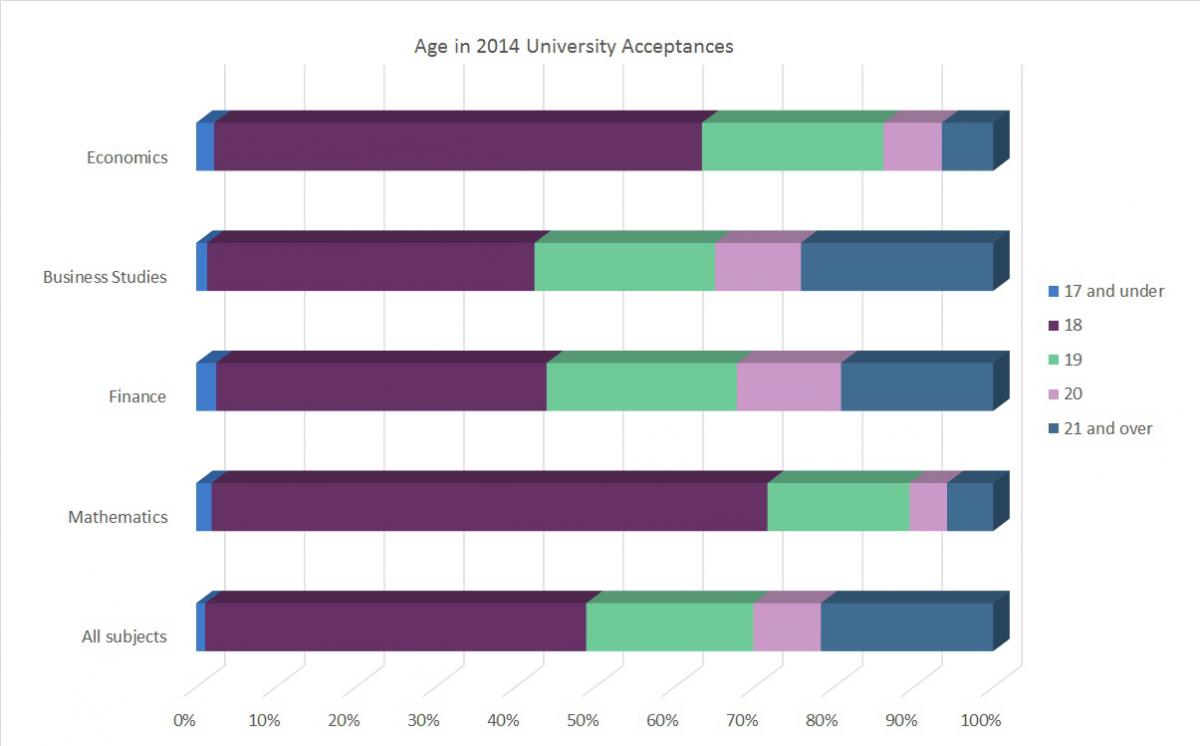
Figure 8 - Age in 2014 University Acceptances - Click to enlarge
Source: Data for figures 7 and 8 is taken from the UCAS 2014 End of Cycle data release.
The National Student Survey
“The National Student Survey is a high-profile census of nearly half a million students across the UK, which has been conducted annually since 2005. Aimed at mainly final-year undergraduates, it gathers opinions from students about their experience of their courses, asking them to provide honest feedback on what it has been like to study on their course at their institution.”[1]
- For questions relating to feedback, Economics and Business Studies courses performed slightly worse than Mathematics and Finance courses.
- When compared with Politics and Sociology courses, Economics performs equally well for the question relating to the promptness of feedback (Q07) but continues to perform slightly worse on the question relating to how well feedback clarifies misunderstandings (Q09).
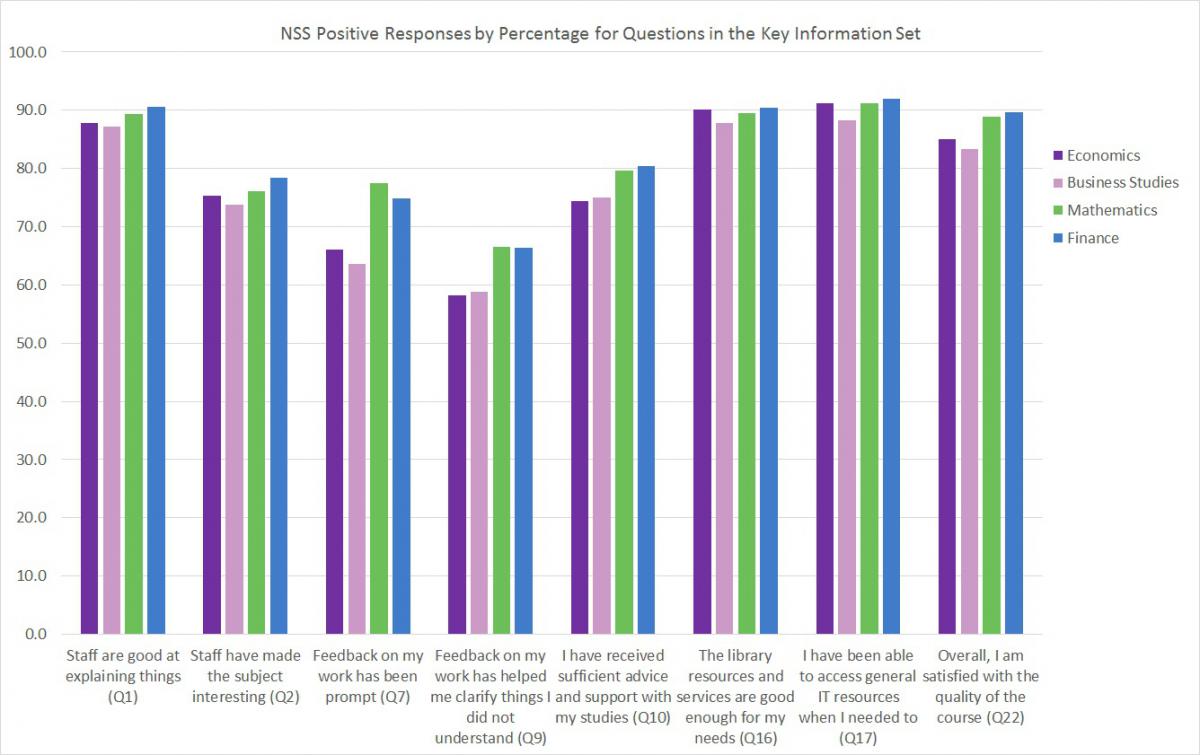
Figure 9 - Positive Responses to the National Student Survey questions included in the Unistats Key Information Set (KIS) by Course

Figure 10 - Positive Responses to Questions on the NSS which related to Feedback by Course - Click to enlarge
Source: Data for figures 10 and 11 is taken from the National Student Survey (NSS) and shows the aggregate responses to questions which are included in the Key Information Set (KIS) as used by the Unistats website. Results have been aggregated from the complete NSS results by totalling the number of students giving positive responses as a percentage of those who completed the survey on each course. Positive responses are considered to be either “Mostly Agree” or “Definitely Agree”. For more information on the KIS see https://unistats.direct.gov.uk/find-out-more/key-information-set.
Destinations of Leavers from Higher Education
“The Destinations of Leavers from Higher Education (DLHE) survey asks those who have recently completed higher education courses about their current activity, which may be working, studying, looking for work or even travelling. Those who are employed are asked for a description of their role and the kind of company they work for so that the nature of their employment can be understood and classified appropriately. They are also how much they are paid.”[2]
- The overall average salary for graduates from courses including Economics in some form 6 months after graduation is between £20,000 and £22,500 with this generally being slightly higher for graduates from Russell Group universities and slightly lower for graduates from Post-1992 universities.
- There is little difference in salary 6 months after graduation between graduates who studied Economics as a single subject and graduates who studied Economics as a minor subject combined with some other course.
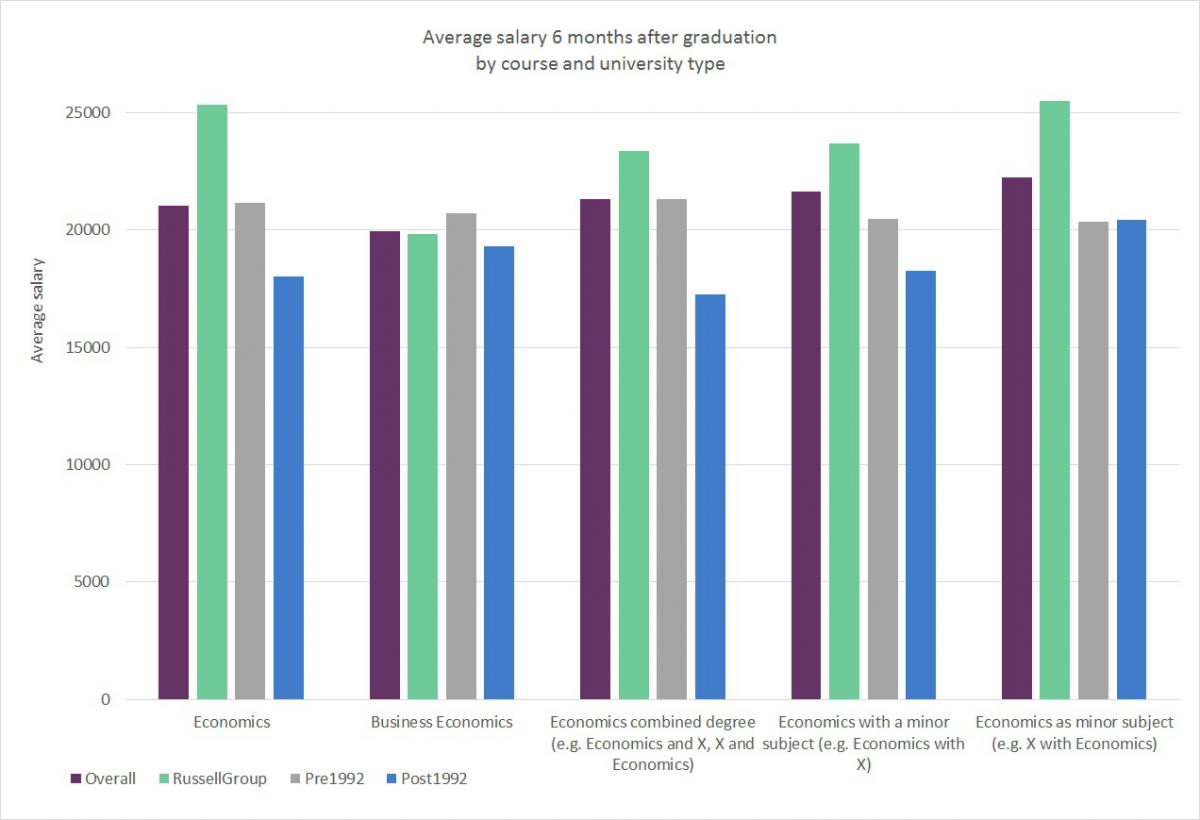
Figure 11 - Average salary 6 months after graduation by course and university type - Click to enlarge
[2] See http://www.thestudentsurvey.com/about.php
↑ Top