Recent trends in UK economics education: A-Level and university applications and acceptances
This report provides an analysis of student numbers in economics at both A-Level and undergraduate level, focusing specifically on applications and acceptances. It covers the period before and during the Covid-19 pandemic. A separate report, available later in the year, will look at entry requirements and enrolments.
This is an update of the 2016 trends in UK economics education report published by the Economics Network.
The charts from this page can be downloaded as a PowerPoint file.
Pre-university analysis
The figures presented in this section are based on data that have been obtained from the Joint Council for Qualifications website. The data presented here excludes candidates that took part in the Autumn exam series as part of the exceptional arrangements for awarding qualifications in 2020 and 2021.
A-Level entrants
- The number of students sitting A-Level Economics and A-Level Business Studies have increased over the last 12 years. Economics has seen numbers increase by 53% and Business Studies has grown by approximately 43% between 2011 and 2022.
- Prior to 2014, and since 2018, the numbers sitting A-Level Business Studies have exceeded those taking A-Level Economics. There has continued to be an increase in demand for both subjects since the start of the pandemic: 18% increase for Economics and 25% increase for Business Studies.
- The number of students sitting A-Level Mathematics increased between 2011 and 2018, fall back in 2019, increasing slightly in 2020 and 2021. A similar profile is observed for A-Level Further Mathematics, although the overall numbers are a lot smaller in comparison.
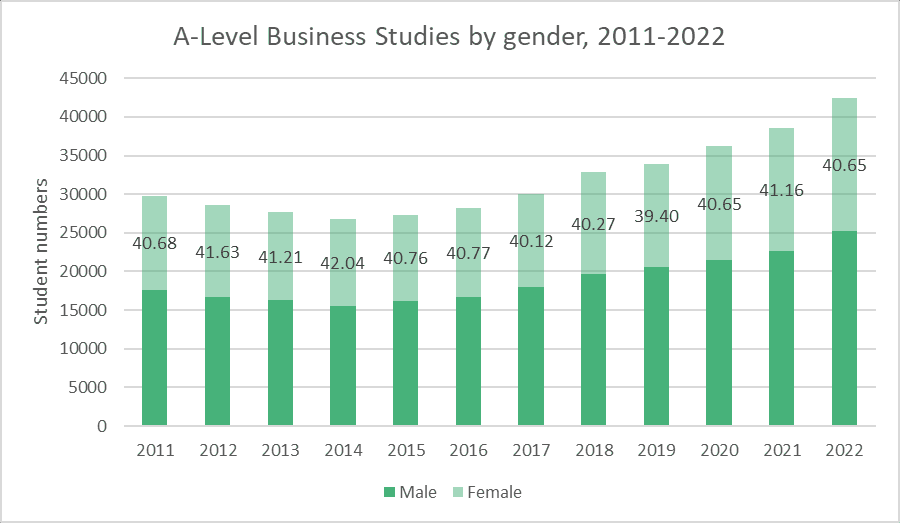
- The proportion of female students studying A-Level Economics has remained constant over time, despite increases in overall student numbers. This is also the case for Business Studies. The proportion of female students studying Economics for the whole sample period (2011-22) averages around 31.7%. The corresponding figure for Business Studies is 9 percentage points higher (40.78%).
Figure 1: A-Level student numbers by subject, 2011-2022
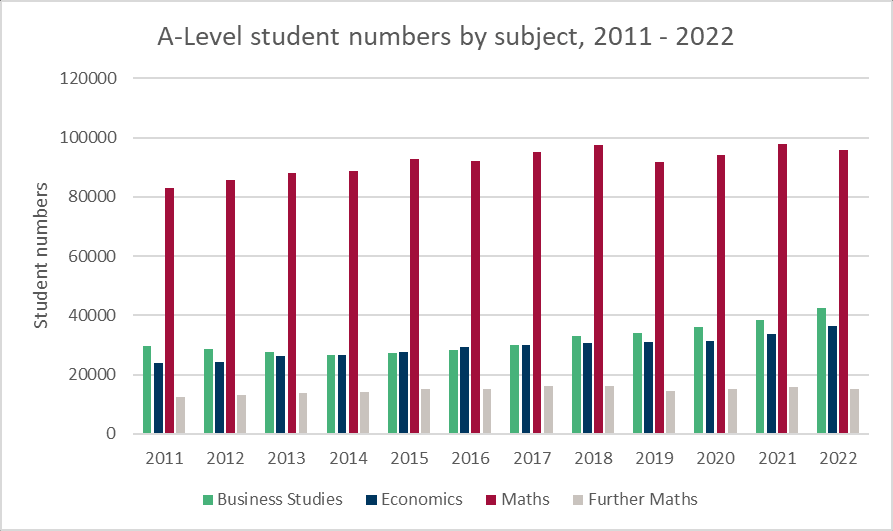
Figure 2: A-Level student numbers, Business Studies versus Economics, 2011-2022
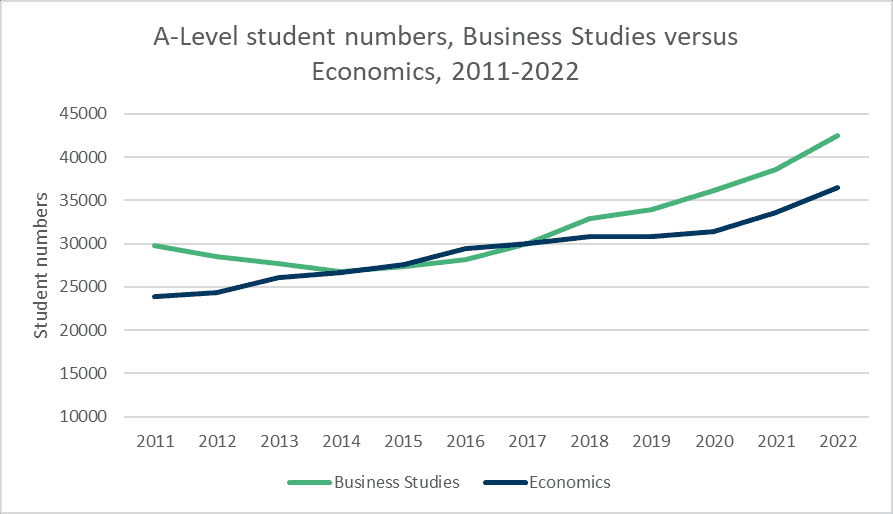
Figure 3: Percentage change in student numbers from previous year, by subject
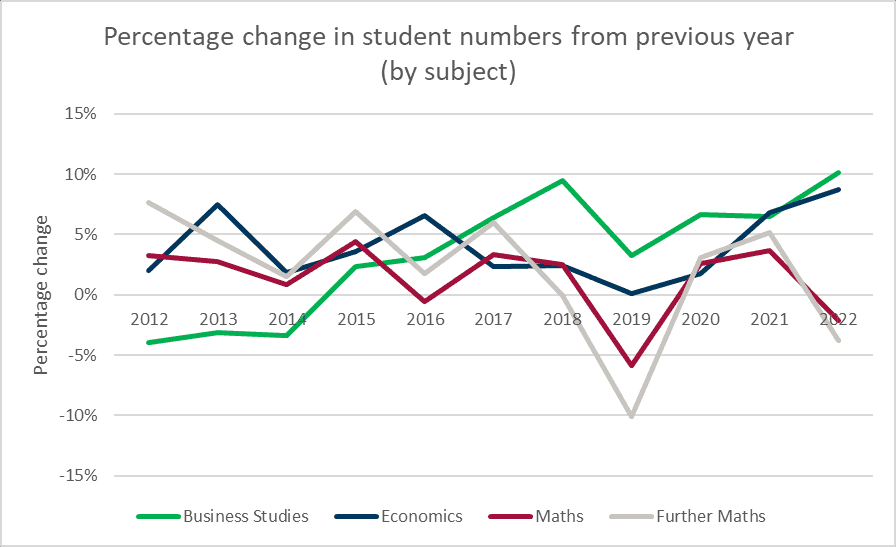
Figure 4: A-Level Economics student numbers and percentage by gender, 2011-2022
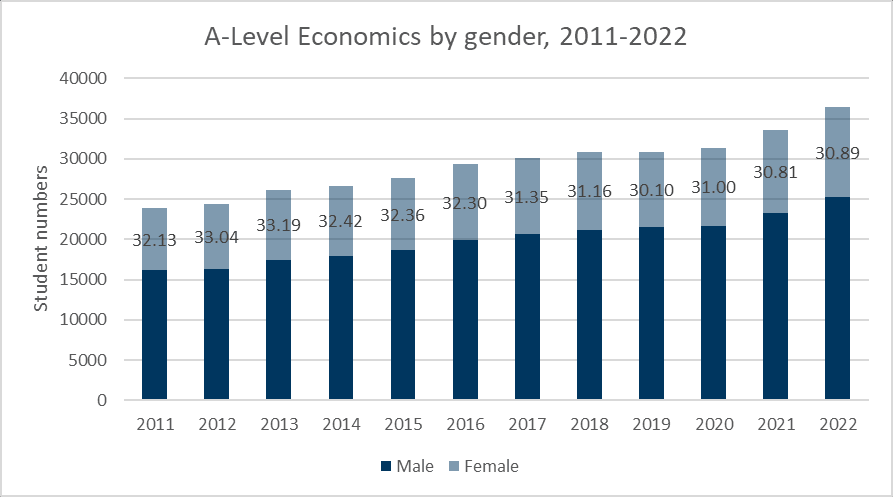
Figure 5: A-Level Business Studies student numbers and percentage by gender, 2011-2022
A-Level performance
- Across each of the five years analysed a higher proportion of A-Level students achieved an A* grade in Further Mathematics compared to Mathematics, Economics and Business Studies. Compared with A-Level Mathematics and A-Level Economics, fewer students achieved an A* in Business Studies.
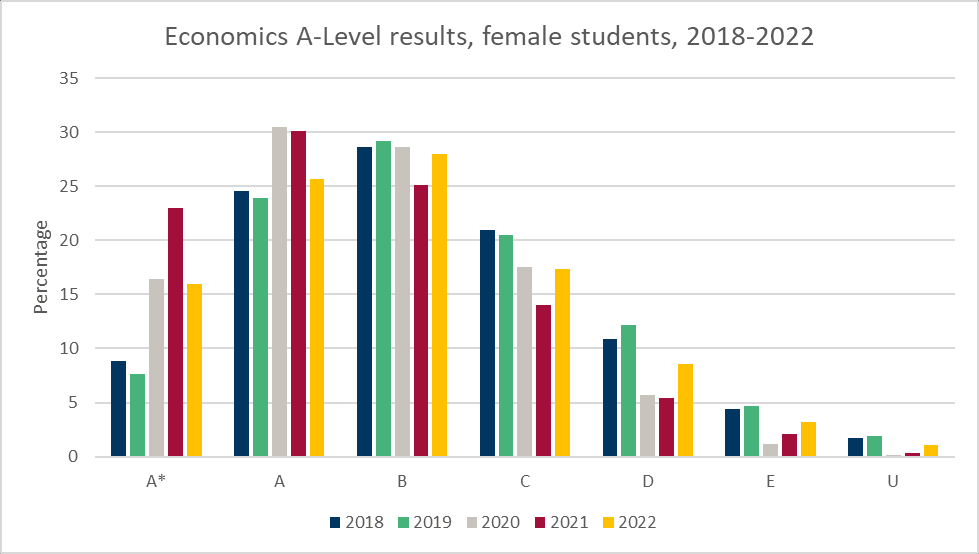
- A notable increase in the percentage of A* and A grades were awarded in 2020 relative to 2019 and 2018. This was due to the cancellation of the summer 2020 examinations and the awarding on grades based on teacher assessment because of the Covid-19 pandemic. A further rise in the percentage of students awarded A* and A across all these subjects was observed in 2021. Performances fell back slightly in 2022 but generally only to the levels observed in 2020 – they therefore remain higher than the typical values seen before the pandemic.
- The distribution of performance across the whole grade profile for Economics over time is similar when comparing male and female students. Female A-level Economics students, on average, perform better compared to their male counterparts, particularly at the higher end (A* and A grades).
Figure 6: Percentage of A* grade A-Level by subject, 2018-2022
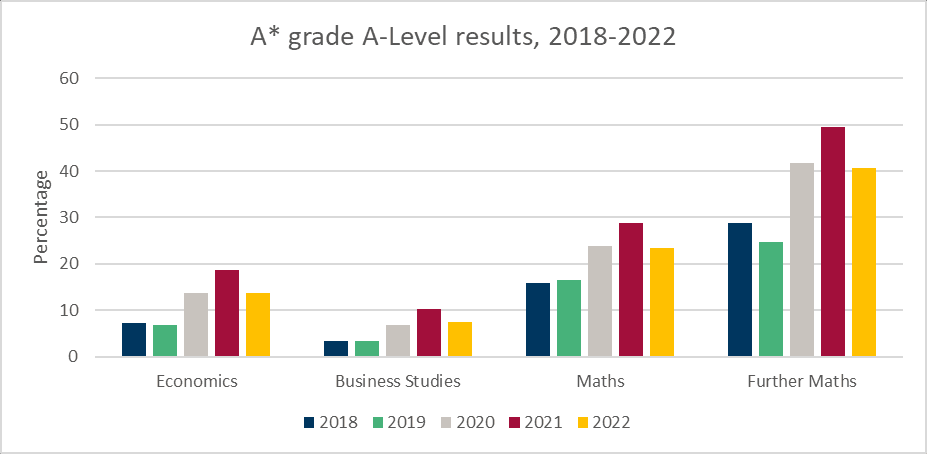
Figure 7: Percentage of A grade A-Levels by subject, 2018-2022
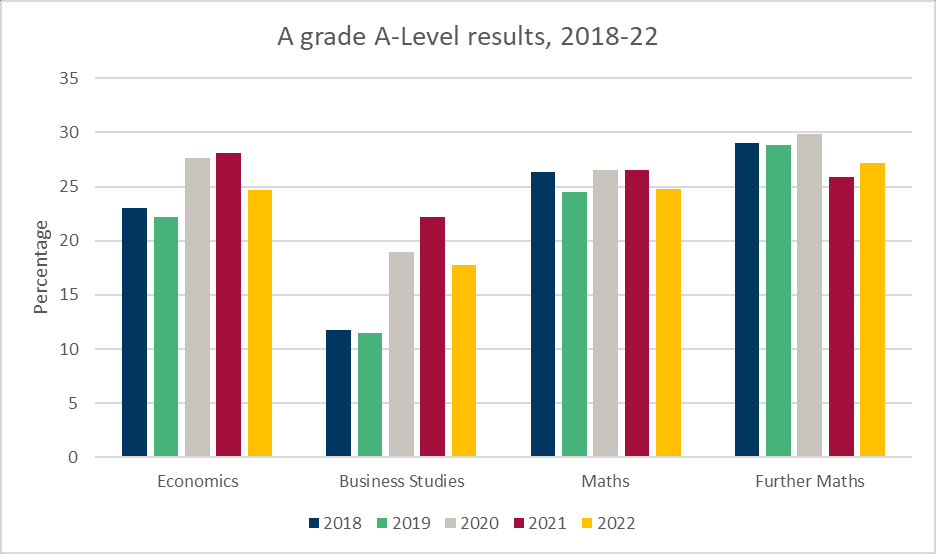
Figure 8: Economics A-Level results, male students, 2018-2022
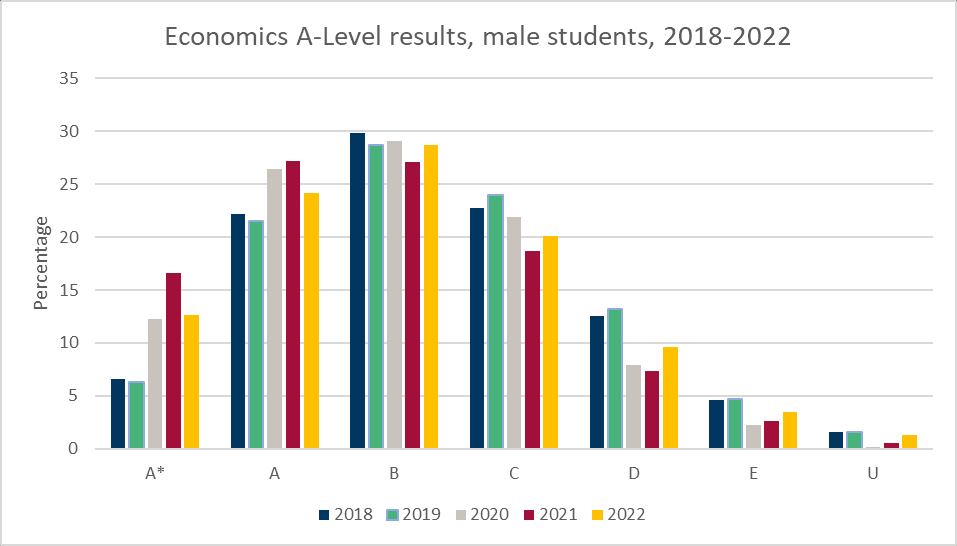
Figure 9: Economics A-Level results, female students, 2018-2022
Undergraduate university applications and acceptances
Applications
All data relating to applications and acceptances have been obtained from UCAS.
A new coding system – the Higher Education Classification of Subjects (HECoS) – was implemented from 2019/20. JACS data, on which this report is based, are only available from UCAS until 2021.
- Increases in applications can be seen for Economics and Finance degrees. For Mathematics the profile is flat, whereas applications for Business Studies courses have declined in recent years. These patterns are consistent across male and female applicants.
- The proportion of male and female students applying for Economics and Business Studies has remained roughly the same over the time-period considered (2011-2021).
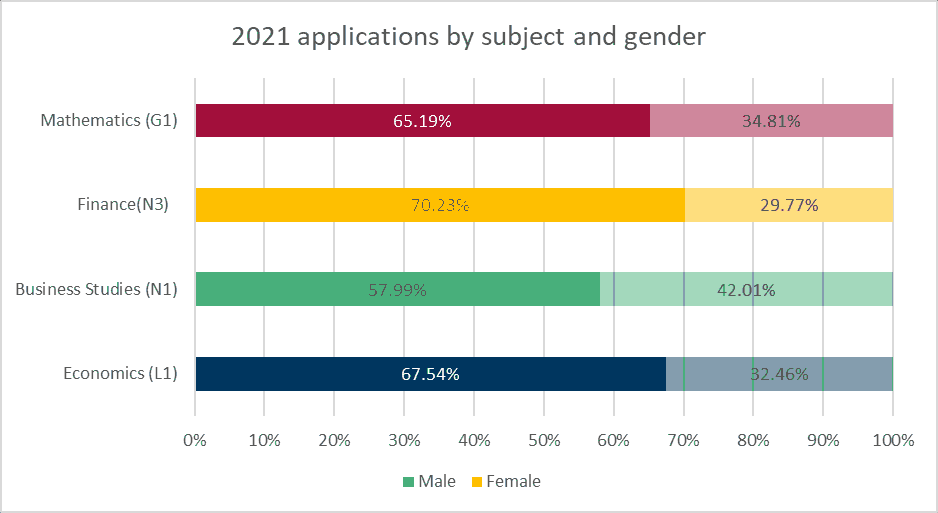
- It remains the case that there is significant male bias in these subjects. The highest percentage of male applicants is in finance where less than 30% of applications are from females (based on the most recently available data – previously this had been as high as nearly 37%). Male applicants also dominate Economics and Mathematics courses. The percentage of female applications to these degree courses is typically in the ranges of 30-32% and 35-38%, respectively. Only Business Studies has consistently had over 40% of applicants who are female.
Figure 10: University applications by subject, 2011-2021
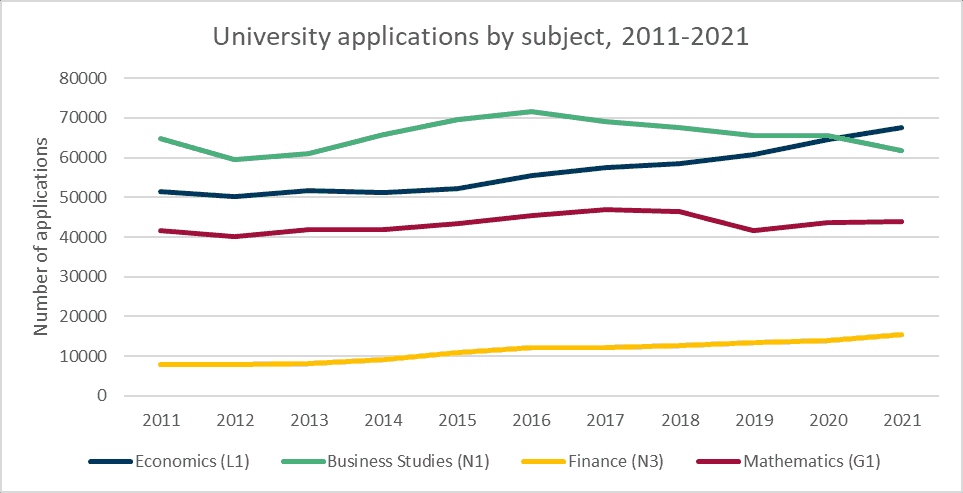
Figure 11: Percentage change in applications from previous year
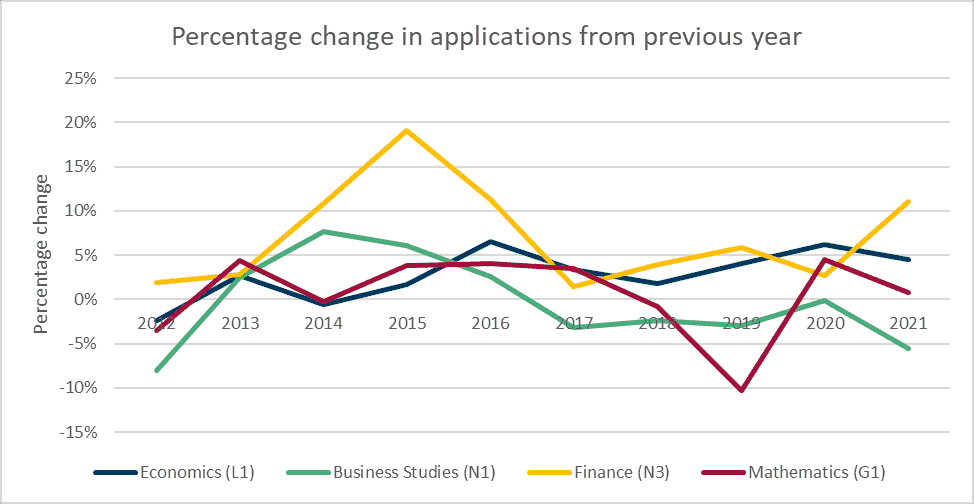
Figure 12: University applications by subject, male applicants, 2011-2021
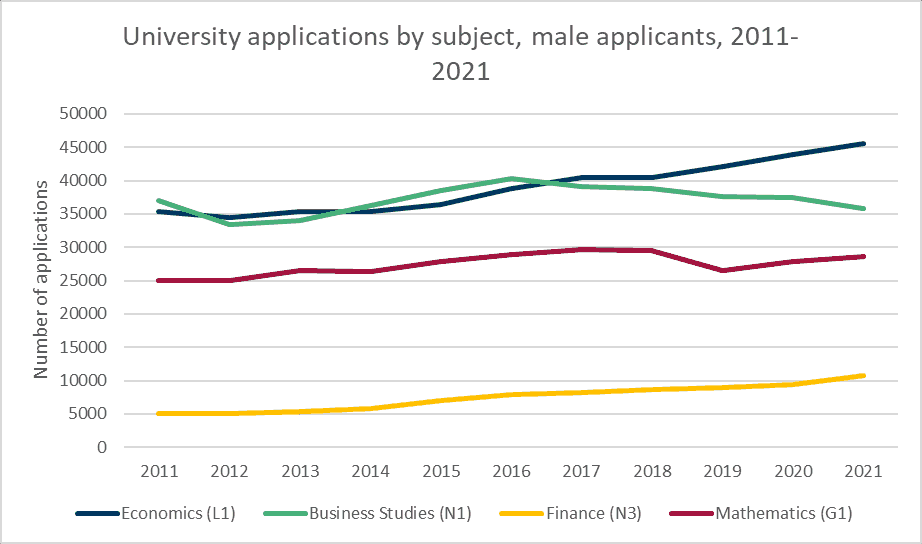
Figure 13: University applications by subject, female applicants, 2011-2021
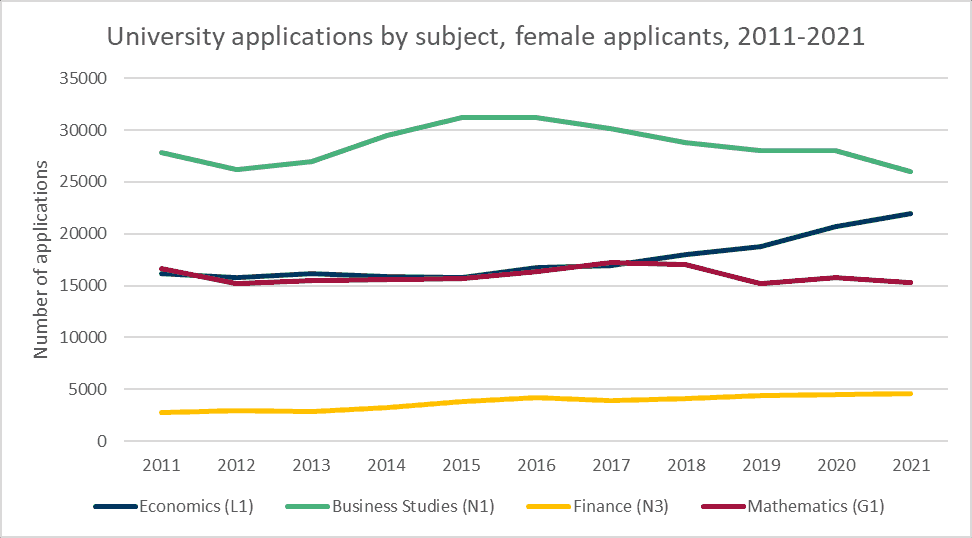
Figure 14: Percentage applicants to Economics by gender, 2011-2021
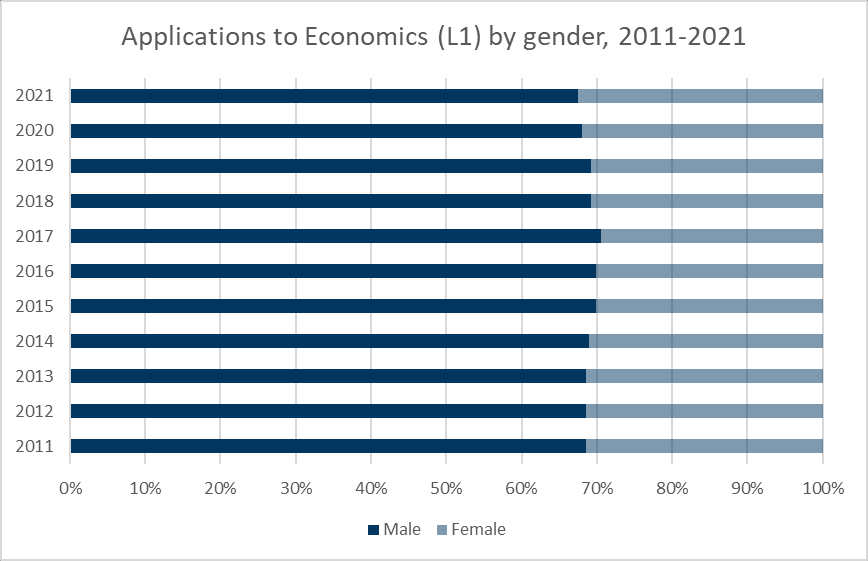
Figure 15: Percentage applicants to Business Studies by gender, 2011-2021
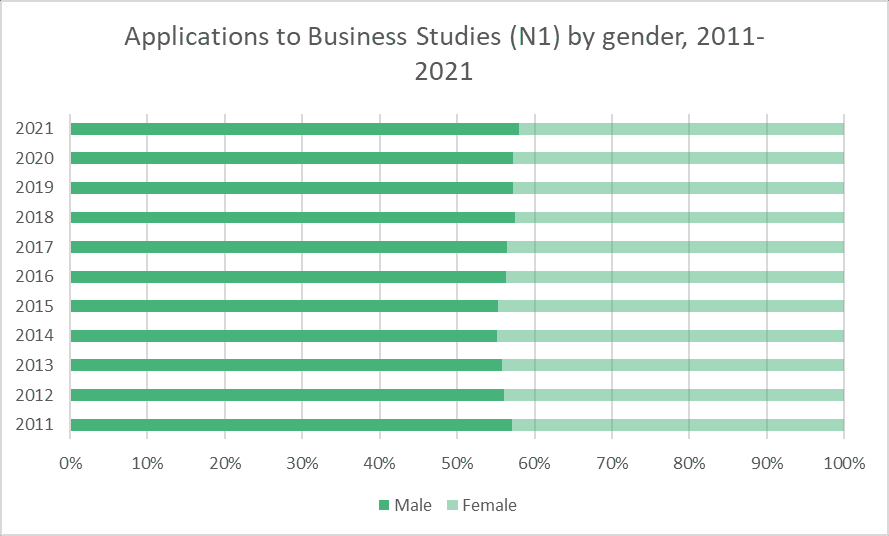
Figure 16: Percentage applications by subject and gender, 2021
Acceptances
- A similar story emerges when considering acceptances to undergraduate courses.
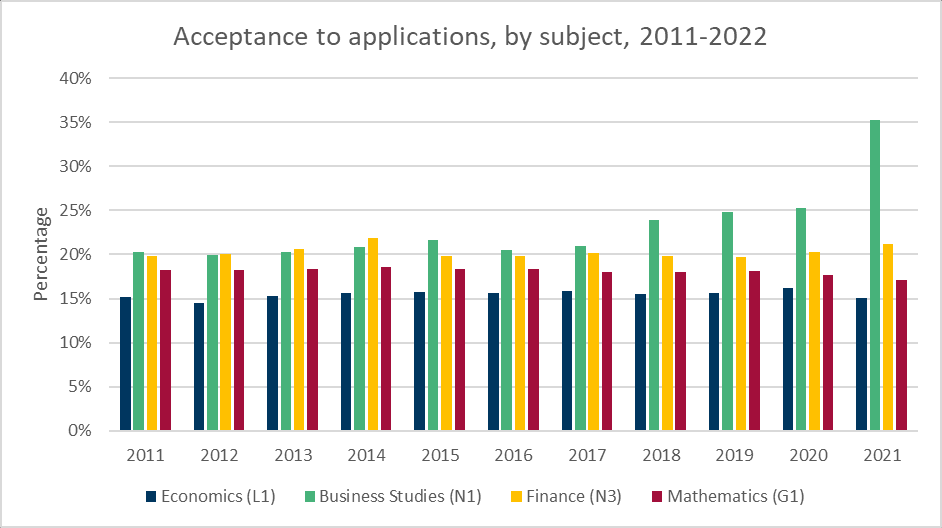
- An interesting finding here is that despite the lower number of applications, there has been a higher number of acceptances in 2021 for Business Studies. This pattern applies for both male and female acceptances.
- Consequently, the acceptance to application rate is much higher for Business Studies in 2021 compared with other subjects and previous years.
- Some growth in acceptances and in the acceptance to application rate is also observed for Finance but this is modest in comparison to the other subjects.
- For Economics, growth in acceptances is observed for most of the time-period considered, with a sizeable increase in growth over the period 2016 to 2020. A decline in acceptances – both for male and female students – has been observed in 2021, which is the first time this has happened since 2012.
- Mathematics has seen a general decline in acceptances since 2017 for male students and from 2018 for female students.
Figure 17: Total acceptances by subject, 2011-2021
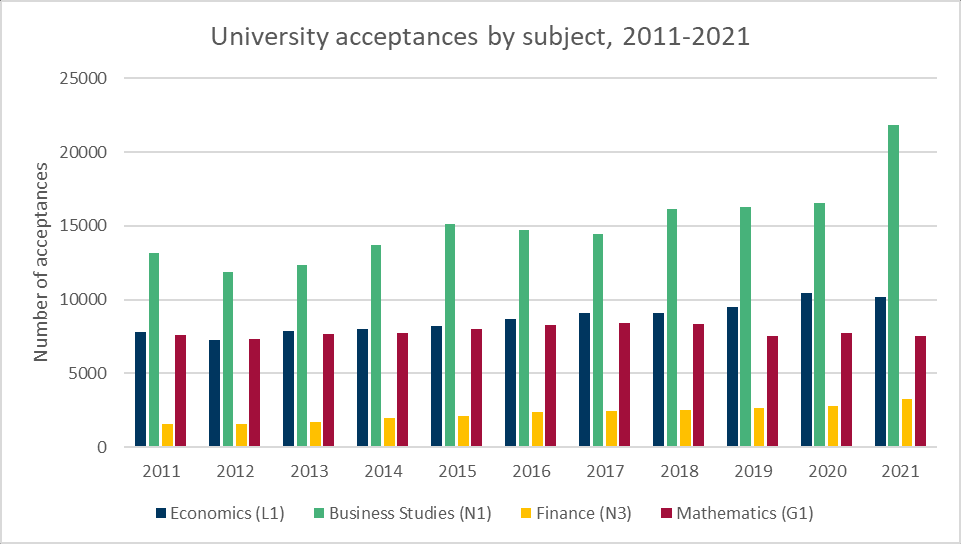
Figure 18: Percentage change in acceptances from previous year, by subject
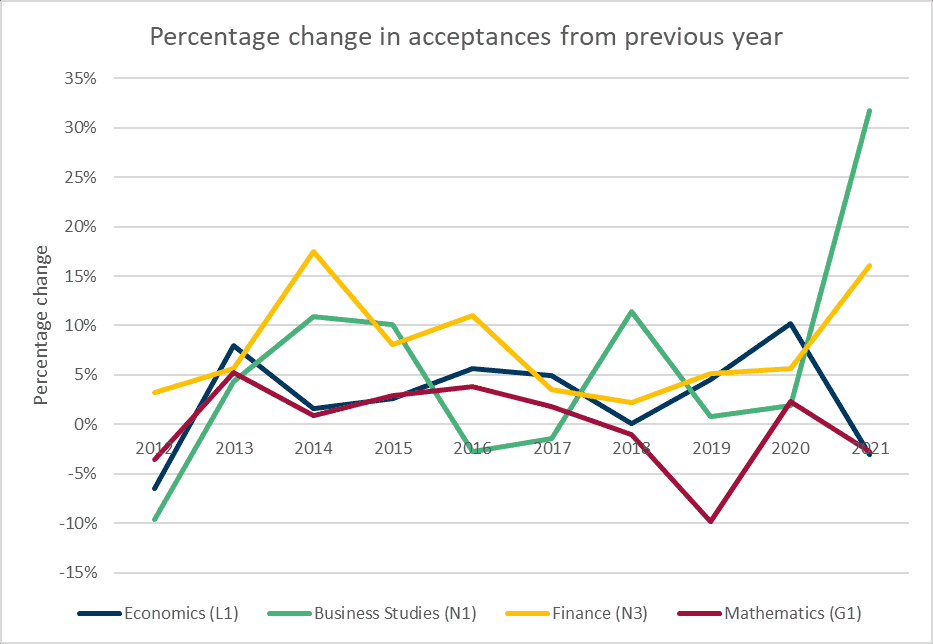
Figure 19: Total university acceptances by subject, male students, 2011-2021
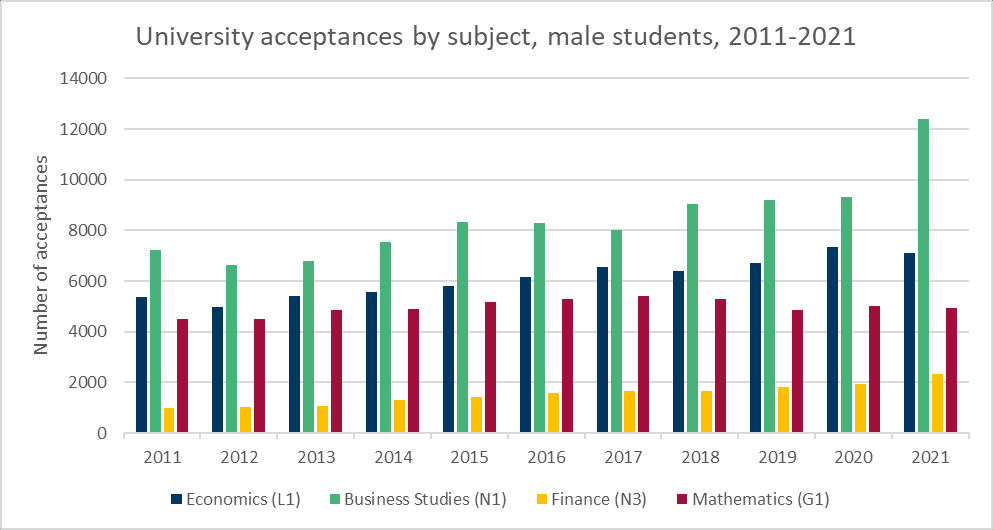
Figure 20: Total university acceptances by subject, female students, 2011-2021
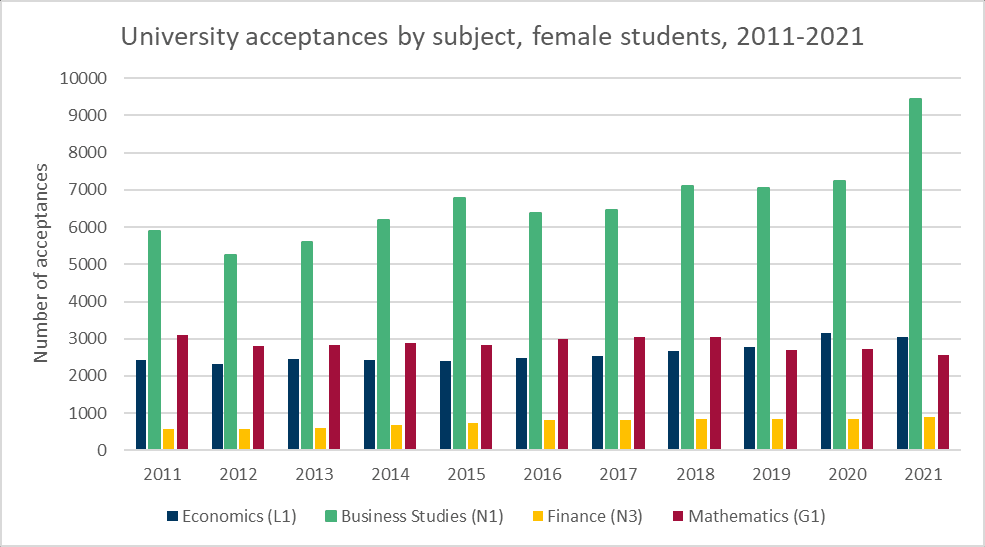
Figure 21: Percentage acceptances to Economics by gender, 2011-2021
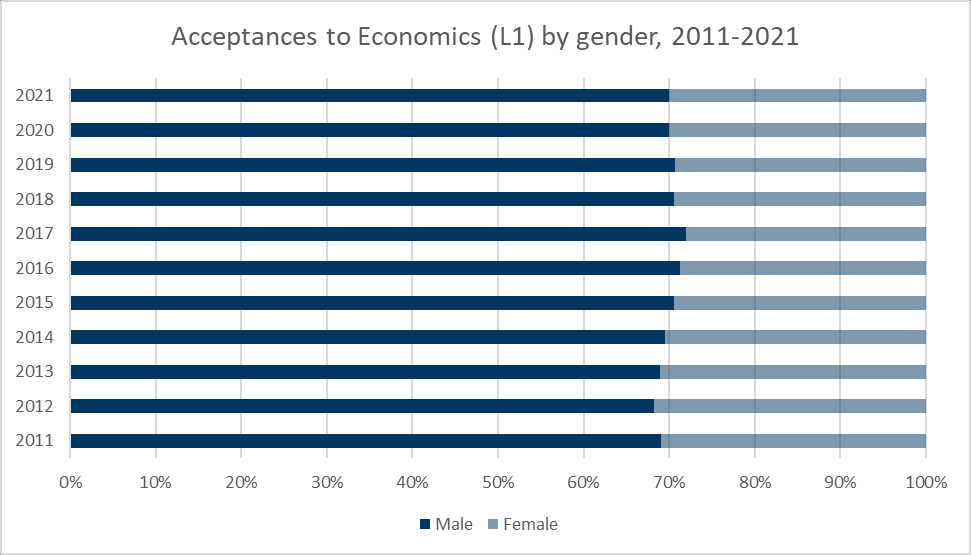
Figure 22: Percentage acceptances to Business Studies by gender, 2011-2021
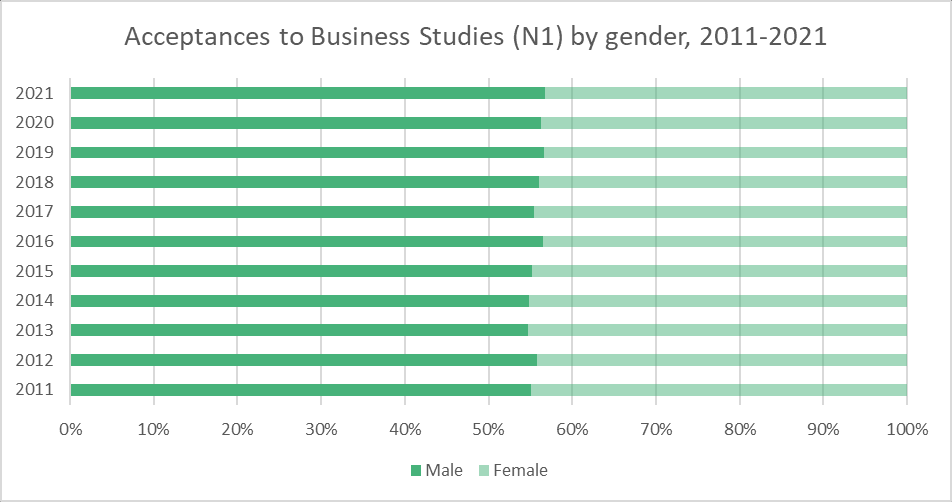
Figure 23: Acceptance to applications percentages, by subject, 2011-2022