National Student Survey Results and Analysis for Economics (2008-2019)
Introduction
The National Student Survey (NSS) is an annual survey conducted by the National Union of Students (NUS) aimed at final-year undergraduates in the UK. With approximate response rates of 70%, the survey constitutes some of the most important data available for gauging student satisfaction. As part of our wider research into the employability of economics graduates, we look at the past 12 years of NSS data up to 2019. To help gain perspective, we compare the results for economics to similar subjects (mathematics, politics, finance and business studies) and also break the results down by university type (‘Russell Group’, ‘Post-1992’ and ‘Other’).
Survey changes
In 2017 the NSS altered their questionnaire, taking the number of questions from 22 to 27. Some changes are very minor; for these questions, we simply treat the 2017-19 data as a continuation of the data collected in previous years (see appendix of full PDF report for details of question changes).
Teaching
Q1: The staff are good at explaining things
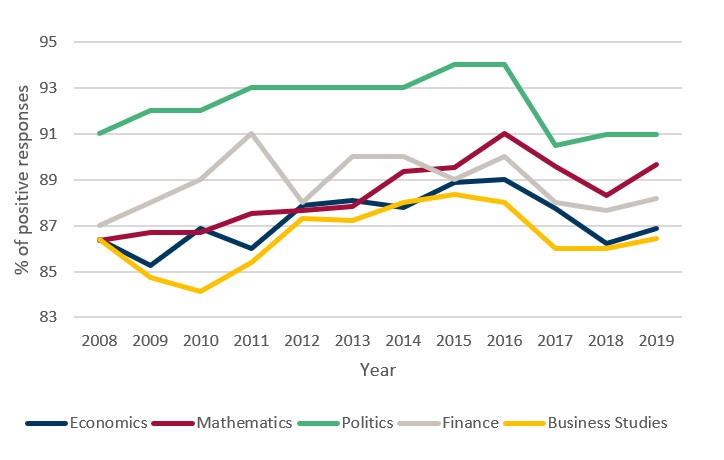
In the most recent 2019 survey, economics sees a positive response rate of 86.9%. Since 2008, economics has been ranked in the bottom two for all but 3 years. However, the positive response rates are still quite strong, with all subjects improving upon their 2018 scores.
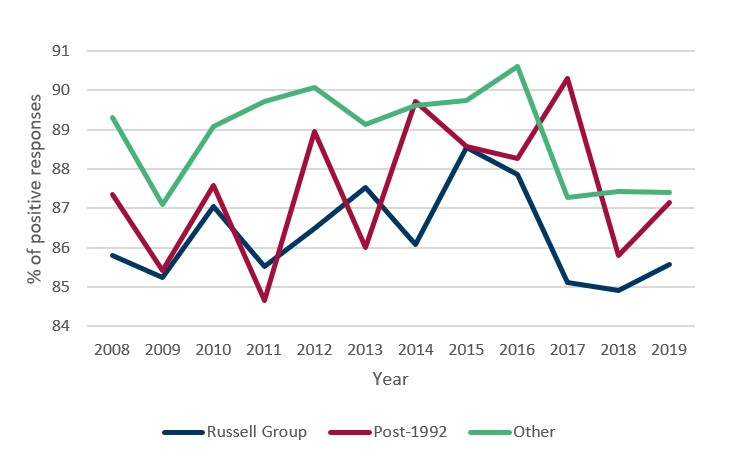
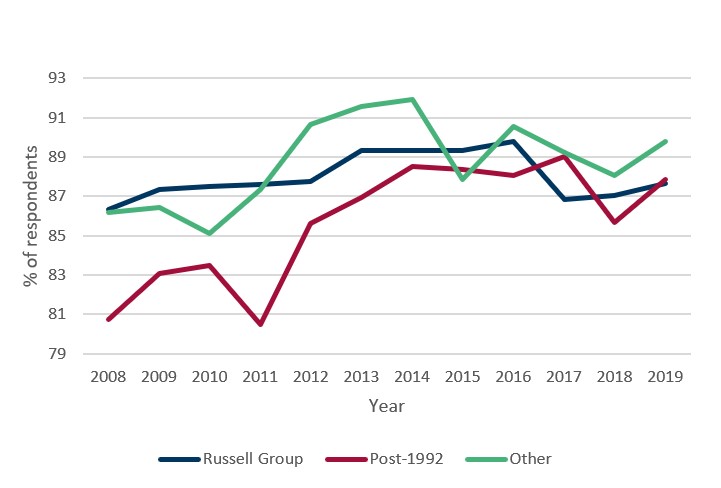
‘Other’ universities have performed the strongest on this question, with a peak score of 90.6% in 2016 before falling to 85.6% in 2019. Both ‘Russell Group’ and ‘Post-1992’ universities also see this decrease in student satisfaction between 2016 and 2018; the rates drop from 87.9% and 88.2% to 85.0% and 86.0% respectively. Both however again increase their scores in 2019. Interesting, all universities have a lower rating in 2019 than in 2008, even with the recent rate rises.
Q2: Staff have made the subject interesting
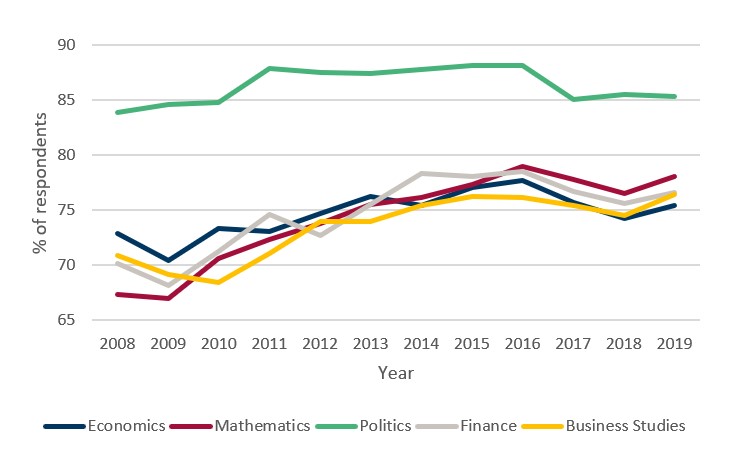
In the 2019 survey, economics receives the lowest proportion of positive responses at 75.5%. Economics, mathematics, finance and business studies all scores within 2.7 percentage points (pp) of one another. All subjects improve their score for this question over the twelve-year horizon.
All three types of university see an improvement in scores between 2018 and 2019. ‘Russell Group’ universities have the lowest score for 10 of the 12 years.
Q3: The course is intellectually stimulating
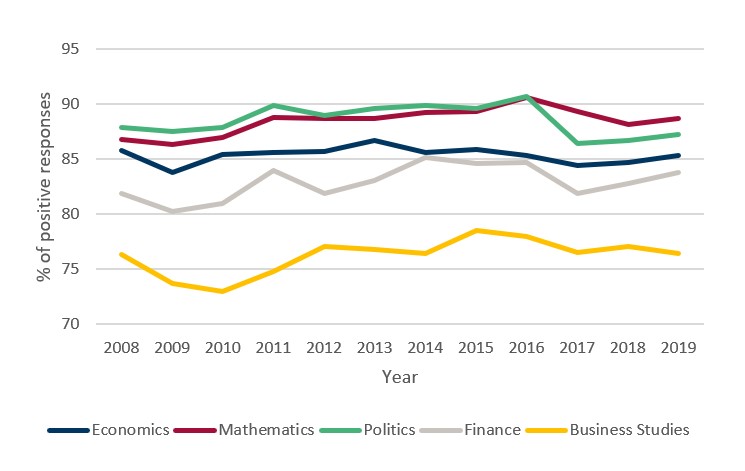
For each individual subject, responses to this question have remained quite stable across the studied horizon. The largest difference in scores between 2008 and 2018 is for mathematics, accounting for only a 1.9pp change over the decade. Economics has the lowest range of any of the subjects, with a maximum of 86.7% in 2013 and a minimum of 83.8% in 2009 (therefore the range is just 2.9pp over the entire horizon).
Q4: My course has challenged me to achieve my best work
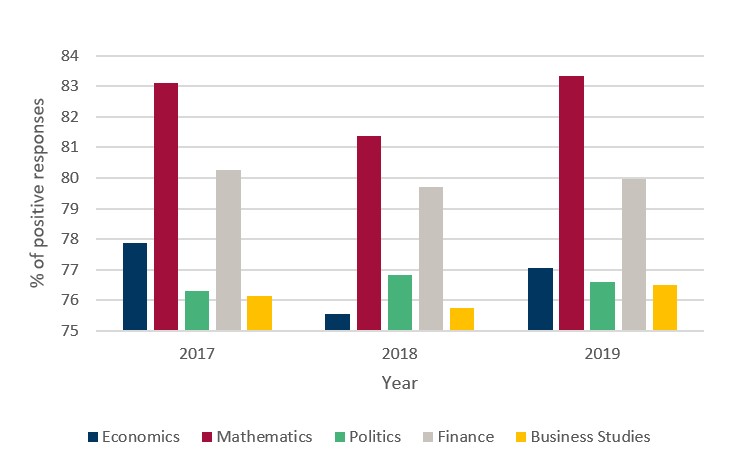
Despite ranking third in 2017 with a score of 77.9%, economics falls into the lowest ranking position in the 2018 survey, attaining a score of 75.6%, but manages to regain the third rank in 2019 with a score of 77.0%. Mathematics attains the highest score for all three years.
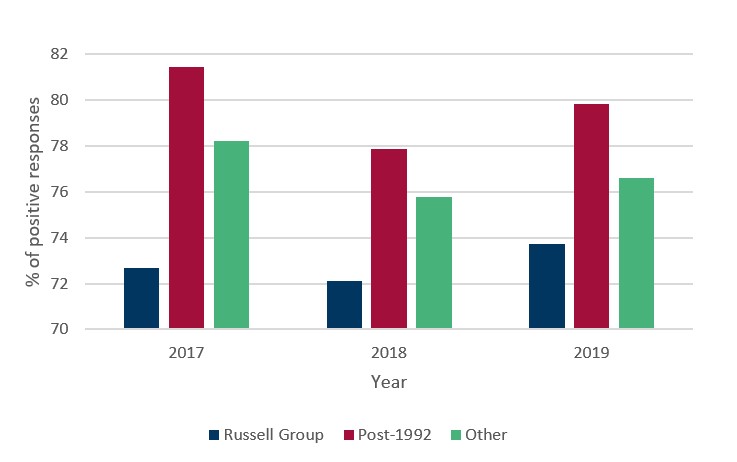
All three types of university see a drop in positive response rates between 2017 and 2018 and a subsequent increase in 2019. Further, the rankings remain unchanged in all three years, with ‘Post-1992’ institutions gaining the highest score and the ‘Russell Group’ universities gaining the lowest.
Learning opportunities
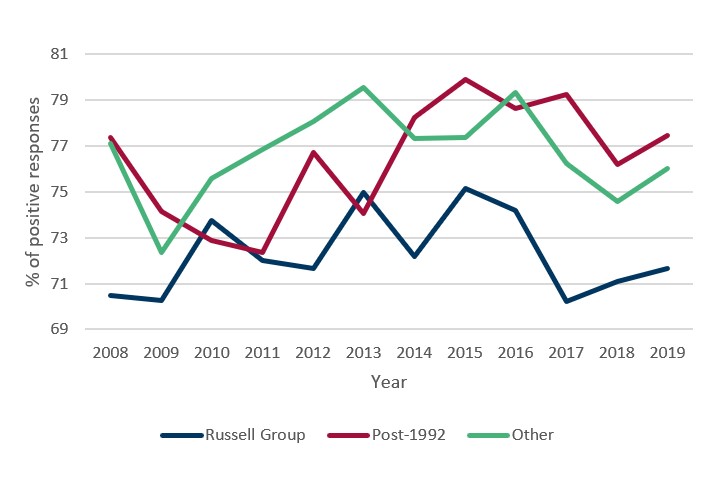
Q5: My course has provided me with opportunities to explore ideas and concepts in depth
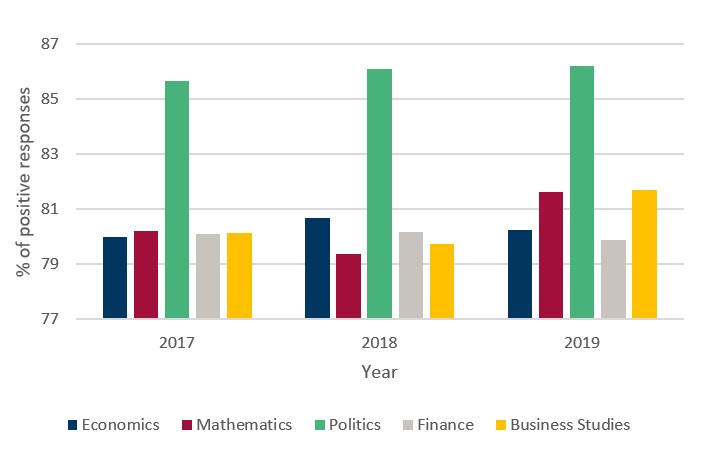
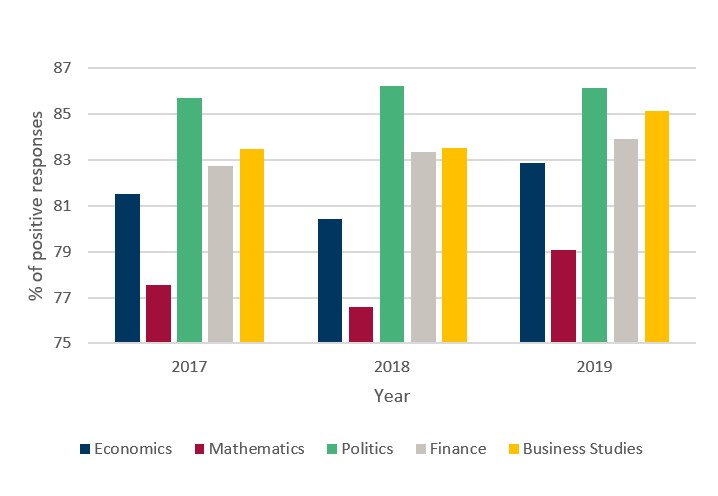
Economics scores are similar in all three years, at 80.0% in 2017, 80.7% in 2018 and 80.3% in 2019. Positive response rates increase in 2019 for mathematics, politics and business studies, with finance seeing a small decrease to 79.9%. Politics attains the highest score in all years by some margin, with a score of 86.2% in 2019. This is 4.5pp higher than the next ranking subject (business studies).
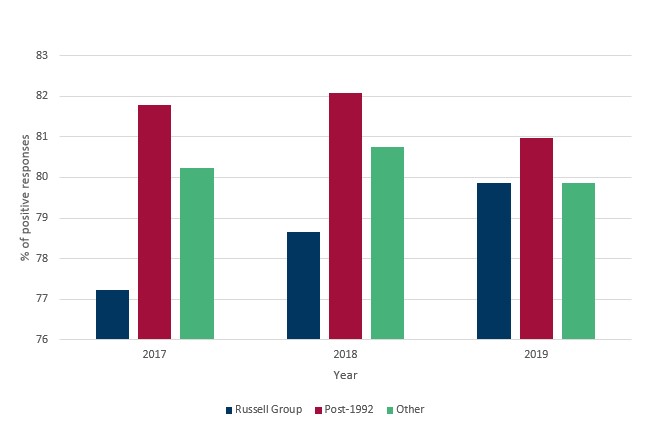
All three categories of university improve upon their 2017 score in the 2018 survey. ‘Russell Group’ universities are however the only category to improve upon their score in 2019, rising from 78.7% to 79.9%.
Q6: My course has provided me with opportunities to bring information and ideas together from different topics
Politics scores highly for this question (86.1% in 2019). Economics improves on its 2018 score with a positive response rate of 82.4%.
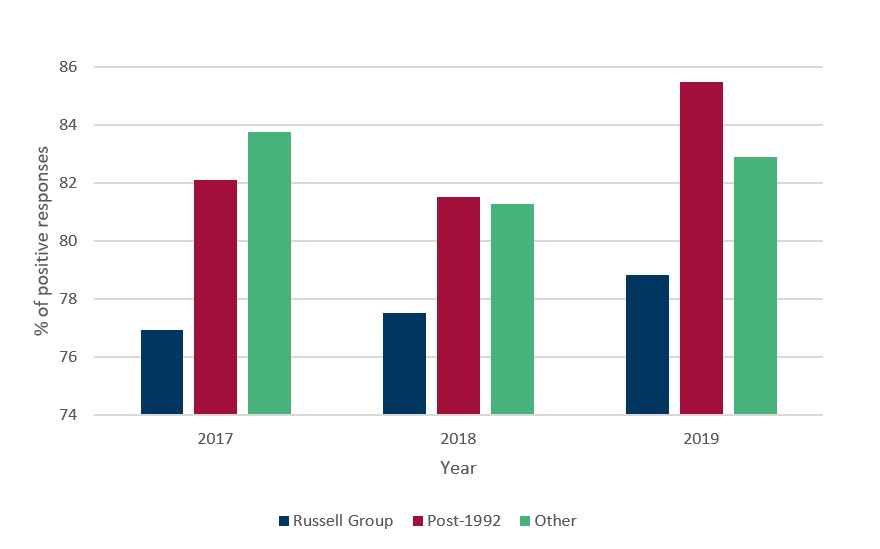
‘Post-1992’ universities obtain the highest positive response rates for 2018 and 2019, while ‘Russell Group’ universities receive the lowest scores in all three years.
Q7: My course has provided me with opportunities to apply what I have learnt<
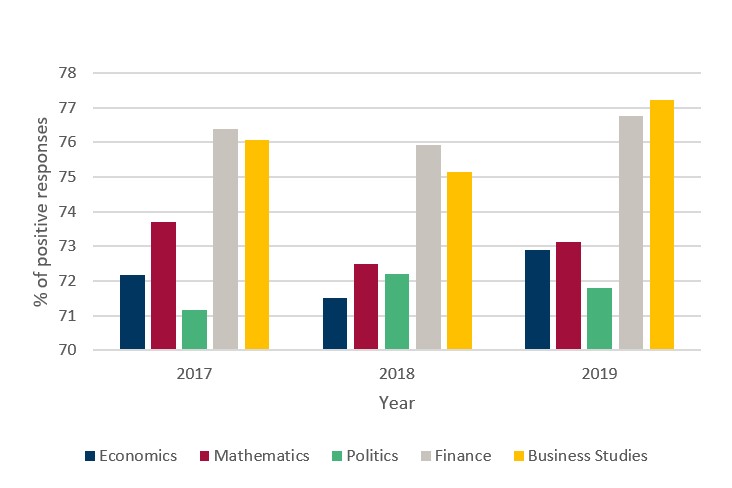
Relative to the other questions in the new ‘Learning opportunities’ section, positive response rates are low. Finance and business studies give students the greatest degree of opportunity to apply what they have learnt, with scores of 76.8% and 77.2% in 2019 respectively. For economics, this score is just 72.9%.
This is at odds with the preliminary results found in both the Employer Survey and ‘Employability in Economics Degrees’ survey conducted by the Economics Network in 2019, where application is consistently rated by staff and employers alike as one of the most important skills for an economics graduate to develop. Many academics also say students get the chance to develop this skill very regularly, and often through summatively assessed activities.
Assessment and feedback
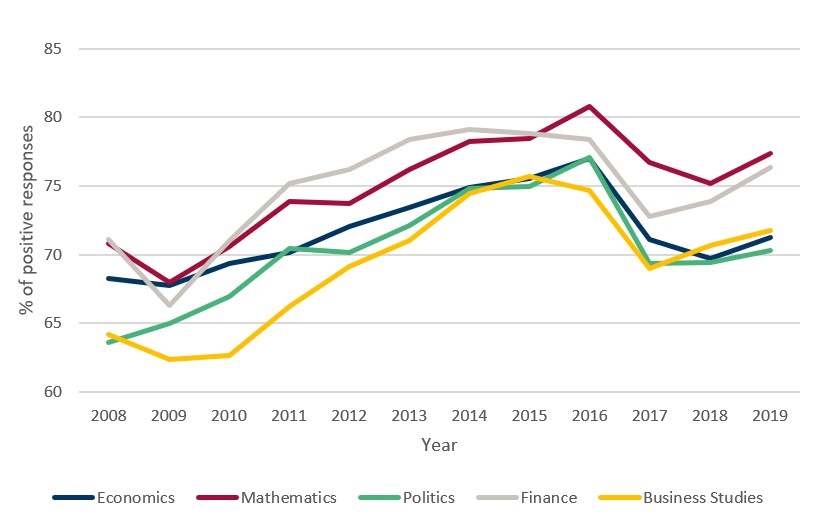
Q8: The criteria used in marking have been made clear in advance
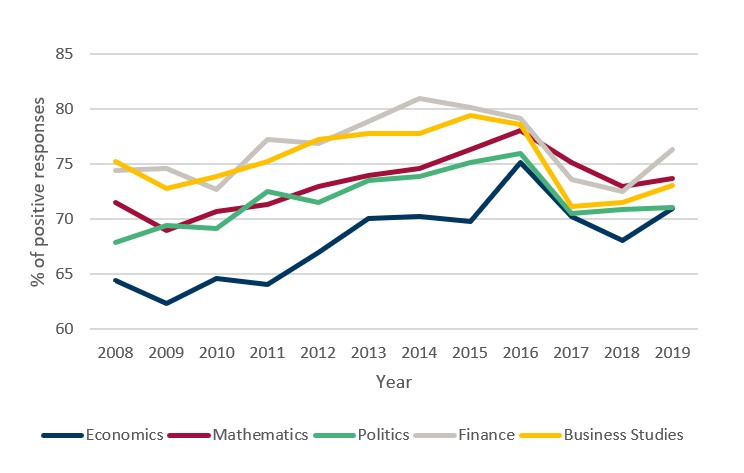
Positive response rates fall sharply for all subjects between 2016 and 2018, but improve in 2019. Economics falls from 75.1% to 68.1% in 2018 - a 7pp decrease between the two years (the average fall between 2016 and 2018 across all five subjects is 6.2pp) – but rises back to 71.0% in 2019. Economics ranks in last place every year in the twelve-year horizon.
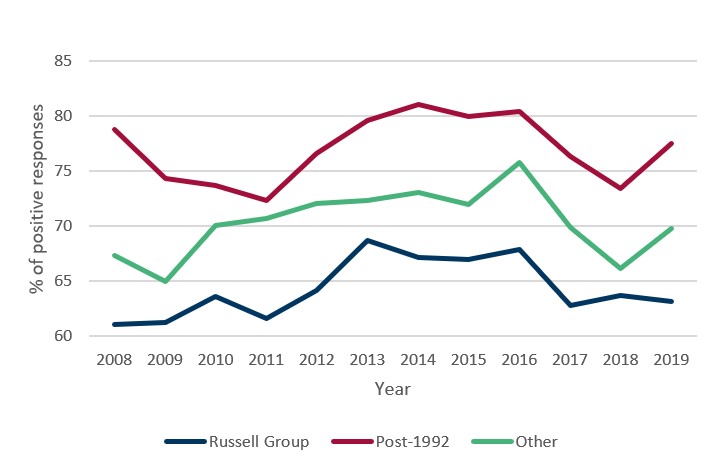
Across the entire horizon, the rankings remain constant with ‘Post-1992’ universities receiving the highest positive response rate, followed by ‘Other’ and then ‘Russell Group’ universities.
Q9: Assessment arrangements and marking have been fair
All subjects see a rise in score between 2018 and 2019 for the fairness of assessment criteria except for politics. For economics, the increase is 1.7pp from 74.0% to 75.7%. Economics, politics and finance all score very similarly across the whole horizon.
All three categories of university see a sharp fall in positive response rates between 2016 and 2018. However, both ‘Post-1992’ and ‘Other’ universities improve in 2019, while ‘Russell Group’ falls further behind.
Q10: Feedback on my work has been timely
Economics, mathematics and finance all obtain a better score in 2019 than 2018; these scores are 70.7% (up from 68.3%), 80.5% (up from 78.6%) and 76.3% (up from 73.9%).
Academic support
Q12: I have been able to contact staff when I need to
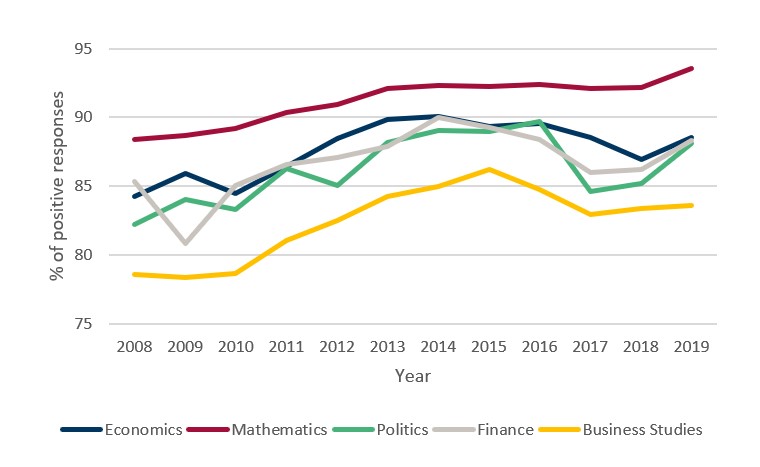
Economics falls from 89.5% in 2016 to 88.6%% in 2019, after peaking at 90.1% in 2014. Rates for politics and finance are similar to economics across the entire horizon.
Results are similar across universities, with staff availability improving for all three types of university in 2019. These high response rates are in line with the ‘Employability in Economics Degrees’ survey which suggests widespread availability of one-to-one academic support from personal tutors.
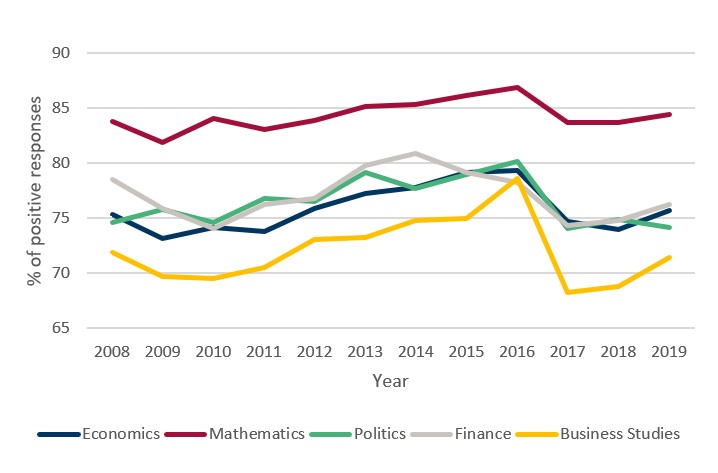
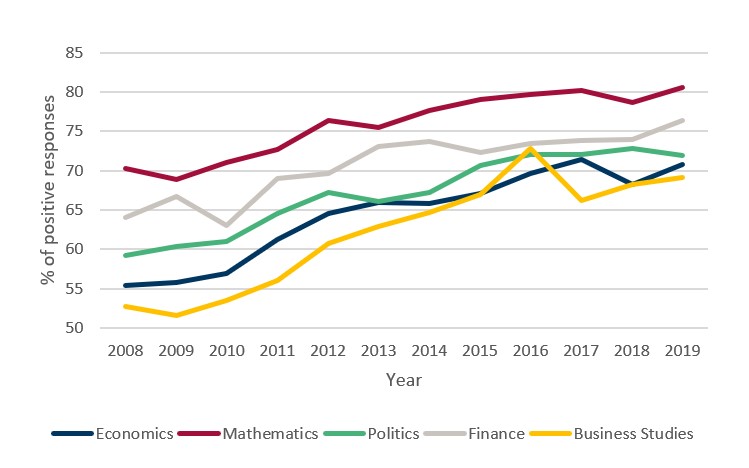
Q13: I have received sufficient guidance in relation to my course

From the graph it appears that the subjects informally trend in two groups; the first high-ranking group comprising of mathematics and finance, and the second low-ranking group comprising of economics, politics and business studies. Within these two groups, relative rankings change frequently. Only finance scores higher in 2019 than in 2016. For economics, this is a decrease from 77.3% to 76.6%. Mathematics attains the 2019 maximum of 80.4%, whilst economics attains the minimum of 76.6%.
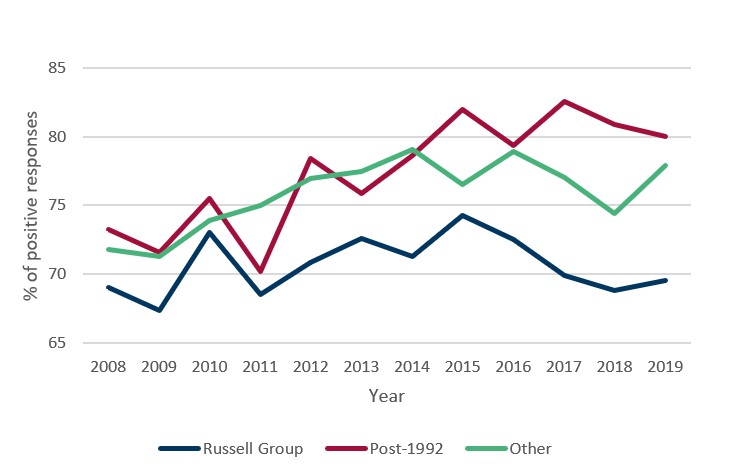
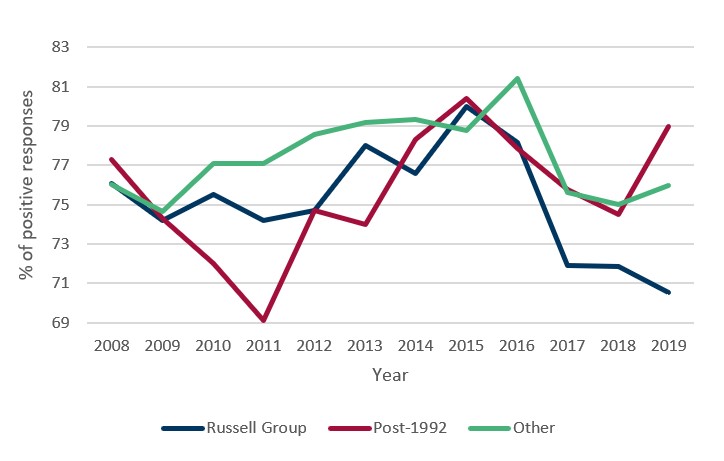
Whilst ‘Other’ and ‘Post-1992’ institutions fluctuate between first and second place, ‘Russell Group’ universities rank last in every year, with year-on-year decreases in positive response rate between 2015 and 2018 (dropping from 74.3% to 68.8%) before an increase to 69.6% in 2019.
Q14: Good advice was available when I needed to make study choices on my course
The general pattern of results for this question is similar to the previous question. Again, mathematics and finance see the highest ratings, and business studies scores the lowest rating in the highest number of years. All subjects again see a decline between 2016 and 2018 before rising again in 2019. For economics, this increase is from 69.8% to 71.2%.
Overall satisfaction
Q27: Overall I am satisfied with the quality of my course
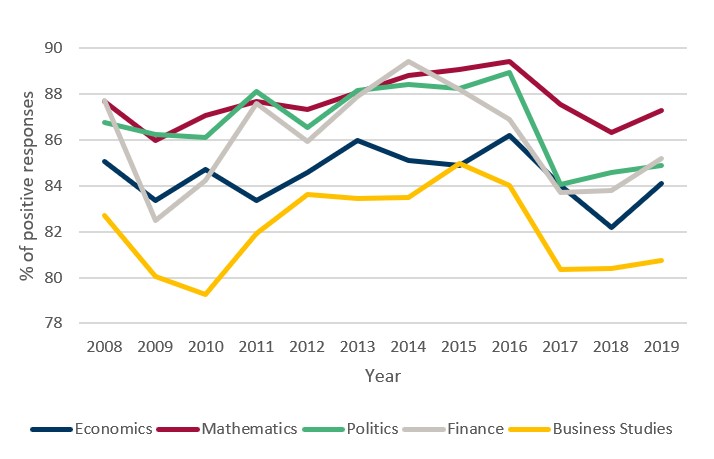
All subjects improve upon their 2018 rating in the most recent survey for overall satisfaction. Rising from 82.2% to 84.1%, economics sees the largest increase. Mathematics scores highest with an overall satisfaction rate of 87.3%, and business studies scores the lowest with a 2019 score of 80.7%.
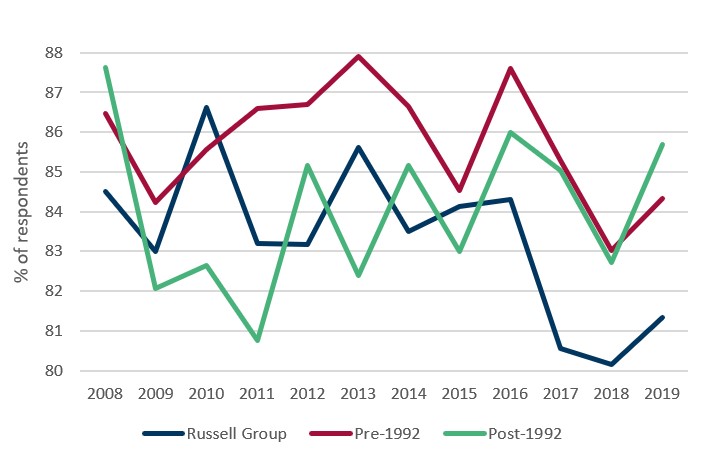
Despite overall satisfaction decreasing since 2016 across institutions, it remains above 80% for all types of university in 2018 and rises across the board in the 2019 survey.
↑ Top