Storytelling with cartoons in economics and statistics
Why cartoons?
Textbooks state theory whereas cartoons explain the theory through a story. The story is more likely to stick in students’ heads whereas memorizing the theory from textbooks might be forgotten easily. The use of cartoons enhances students' learning experience, fosters understanding, and boosts their attention and participation (Garner, 2005 and Ugur et al., 2012). I have found the same in my own undergraduate and postgraduate classes as well as cartoons being effective teaching materials and contributing to the smooth delivery of my lectures.
For example, one of the cartoons, "The Hatman," is designed to teach Ordinary Least Squares (OLS), a widely used statistical method in a range of fields. This example specifically targets students who have not studied maths and statistics beyond post-16 education. I know the topics they struggle with, so the cartoons target those topics which also makes these teacher-created cartoons unique.
Please find below the story for the Hatman cartoon:
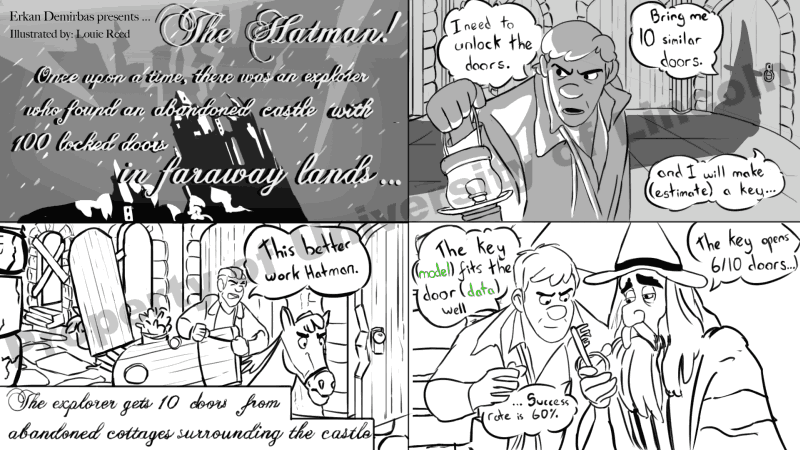
The Hatman
Once upon a time, there was an explorer who discovered a castle with 100 locked doors. Puzzled about how to explore what lay behind them, he sought advice from the blacksmith called the Hatman. The Hatman asked him to bring a couple of doors to make a key.
The explorer returned to the castle and collects 10 doors manufactured by the same company from the cottages in the surrounding area.
He took them to the Hatman and, after some diligent work, the Hatman made a key which opened 6 out of the 10 doors. Delighted with this success rate, the explorer anticipated being able to unlock 60 doors in the castle. And the explorer was very satisfied as `The key fits the lock well`
In statistics, analysts are very happy with a high success rate that corresponds with the R squared and say that “The model fits the data well”.
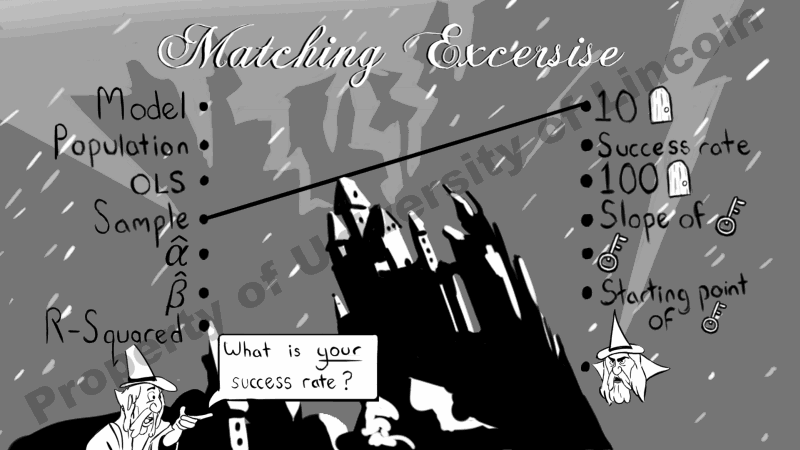
The following box shows how the components of the story are mapped with theory.
Box 1: Mapping the components of storytelling with the theory
- In this story,
- The Hatman represents the ordinary least square,
- 100 doors represent the population,
- 10 doors represent the sample,
- the key representatives the model,
- locked doors symbolize the residuals,
- doors represent the data,
- the explorer symbolizes the analyst
- the success rate 60% represents the R-squared
Remember the following lines:
The key fits the door well.
The model fits the data well.
As listed above, all the components of the theory are mapped with the components of the story. For instance, the goodness of a model is measured with R-squared, which is mapped with the success rate that is the percentage of doors unlocked by the key in the story.
Furthermore, the expression of "The model fits the data well" is used when R-Squared is high. However, this statement might not be especially understandable to students who have not been exposed to mathematics beyond post-16 education.
To help them comprehend the meaning of this interpretation, I exploit the power of analogies in my stories. For instance, I intentionally incorporate the following sentence in the Hatman cartoon: "The key fits the door well." this reflects something already understood from daily life experiences.
Next, I establish connections between the components of this sentence and the components of the theory in the following manner: the key represents the model, and the door symbolizes the data. Finally, I merged these two sentences as follows: "Just as the key is employed to unlock the door, in the Ordinary Least Squares (OLS) method, the model is utilized to interpret the data."
Making the cartoons
Developing storytelling examples involves constructing narratives with integrated components and clear, causal, and logical connections. Furthermore, these narratives must proficiently convey valuable information. These principles are essential for meeting the criteria established by Gentner (1983) for effective analogies.
For this purpose, I created stories by using my imagination. This is the most important part of designing a storytelling example as it requires establishing a strong and clear connection between the components of story and theory. Later, I shared this story with two students from Film and Media Department for illustration. Moreover, I explained to them the theory and helped them understand how the story and theory were connected. Facilitating this information, the draft version of the cartoon was prepared within two weeks. Then, cartoons were finalized by following the comments provided by the members of the project team including three staff members and members of the focus group students including two year 1 and two final year students.
The cartoon production process also involves naming the cartoon. I prefer to assign intriguing names to the cartoons to spark students' curiosity, as illustrated in Table 1 below.
Examples
Using the cartoons in the course
To help students easily grasp the connection between the theory and the cartoon, we included FYI boxes, some relevant graphs and an exercise sheet that is designed to match the corresponding components of the story with theory.
Furthermore, to promote inclusivity for students with colour blindness, some of the cartoons are prepared in black and white. Additionally, to uphold principles of Equality, Diversity, and Inclusion (EDI), we included images and names from various backgrounds, including those from BAME communities.
I shared these cartoons with my students during classes, made them available on the Blackboard site, and extended their accessibility to a wider audience through social media tools, such as LinkedIn.
We developed eight cartoons to explain several topics in economics and statistics as listed below. For example, the Star Air Force cartoon is designed to explain when to accept or reject the null hypothesis by using the T-value approach.
Table 1: List of teacher-created cartoons
| Title of the Cartoon | Subject | Topic |
|---|---|---|
| The Hatman | Statistics | Ordinary Least Square Method |
| Star Air Force | Statistics | Hypothesis test (T-value approach) |
| Rejected Present | Statistics | Hypothesis test (P-value approach) |
| Large belly | Statistics, Finance | Understanding the difference between large standard deviation and small standard deviation |
| Bank Heist | Finance | Understanding the relationship between risk and expected return |
| Spare Tyre | Macroeconomics | Understanding components of Balance of Payments and interaction between them |
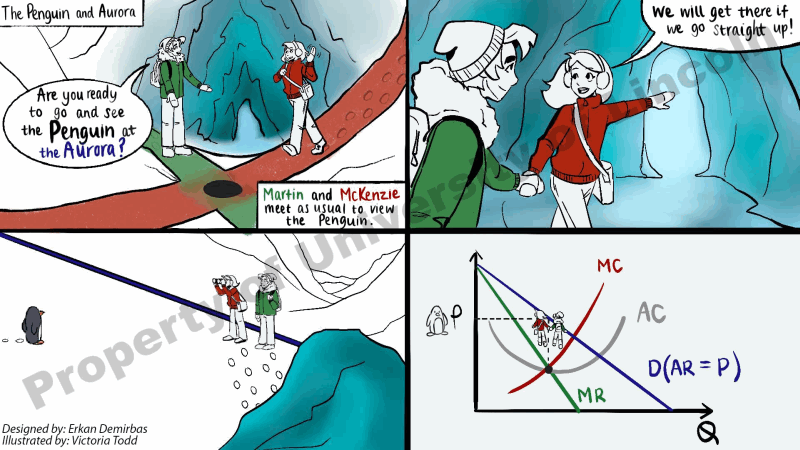
| Penguin and Aurora | Microeconomics | Price Determination in imperfectly competitive markets |
| Fallen Boomerang | Macroeconomics | The impact of increasing money supply under fixed exchange rate regime |
Student response
I used these cartoons as supplementary teaching materials. Facilitating these new materials in my lectures significantly contributed to the delivery of classes and substantially improved students' satisfaction with undergraduate and postgraduate level programmes.
For example, The Hatman cartoon was received positive feedback from PG level students with an overall satisfaction rate of 4.9 from 13 respondents. Moreover, The Star Air Force illustration earned an impressive rating of 4.5 from 43 respondents, with an overwhelming 98% expressing a keen interest in more examples. According to student feedback, the cartoons significantly enhanced their understanding of the theory, as highlighted in the following comments:
"It's something different that helps us to stay engaged during lectures and seminars and concentrate better on the material."
"Very much to the point."
"For anyone who doesn't have a background in econometrics, they can easily relate to the images and understand the concepts better."
"The model has become very understandable for me. Great job and very simple."
"Yes, it helps a lot. It illustrates the idea very well and in a practical manner. We can relate to it and understand it easily.
Lessons learned
I’ve come to understand that involving students as producers significantly enhanced the quality of our work. Furthermore, gathering feedback from focus groups on the cartoons was crucial for amplifying their impact and fostering inclusivity.
References
Garner, R. (2005). "Humor, Analogy, and Metaphor: H.A.M. it up in Teaching". Radical Pedagogy, vol. 6, no. 2.
Gentner, D. (1983). "Structure mapping: A theoretical framework for analogy". Cognitive Science, vol. 7, no. 2, 155-170. https://doi.org/10.1016/S0364-0213(83)80009-3
Ugur, G., Dilber, R., Senpolat Y, Duzgun, B. (2012). "The Effects of Analogy on Students' Understanding of Direct Current Circuits and Attitudes towards Physics Lessons". European Journal Of Educational Research, vol. 1, no. 3, 211-223. https://doi.org/10.12973/eu-jer.1.3.211
↑ Top