Illustrating the econometric analysis of causality via an application to the UK housing market
1. Abstract
This case study provides an empirical application of alternative tests of causality to regional house price data for the UK. The intention of the present analysis is twofold. First, standard textbook presentations outlining the structure of causality tests are supplemented by the provision of a practical empirical demonstration of the tests involving a topical example. Second, the analysis presents an application of the causality tests of both Granger (1969) and Geweke et al. (1983) to allow a comparison of their structures and properties. As a result, the present case study provides practical illustrations of causality analysis in practice along with data to permit both replication of the findings obtained and further analysis. As a by-product, the data considered allow a vehicle for unit root and cointegration analysis for teaching purposes.
2. Alternative tests of causality
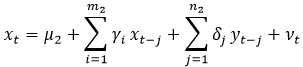
Following the work of Granger (1969), the analysis of causality has become a popular topic in econometric analysis. While this seminal study makes reference to consideration of the relationships between economic variables within the context of a ‘universe of information’, the examination of causality is often performed within a bivariate setting. Ignoring the (perhaps) controversial, or problematic, notion of instant causality[1], the analysis of Granger causality between two stationary series {yt, xt} can be examined via the following testing equations:
(1) 
(2) 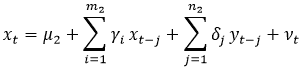
where the null hypothesis of no causality from xt to yt (x ⇸ y) is considered via H0: Βj = 0 ∀j in (1) and the null of no causality from yt to xt (y ⇸ x) is considered via H0: δj = 0 ∀j in (2). In both cases an F-test statistic can be derived to test the null. While the above equations (1) and (2) follow the standard approach of including intercept terms (µ1, µ2) only as deterministic regressors (note this is the default option for EViews), alternative approaches to the inclusion of deterministic terms have received attention in the literature with Cook (2008) providing a discussion of their impact and implications. With regard to the numbers of lags included, various options are adopted in practice, with (m1, m2, n1, n2) often determined via the use of an information criterion or according to data frequency. However, while there is obviously no requirement that m1 = n1 or m2 = n2, these lag truncation parameters are regularly set equal within empirical analyses.
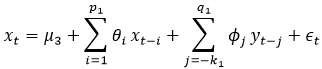
An alternative popular test to examine potential causal relations between economic series is provided by Geweke et al. (1983). Building upon the work of Sims (1972), this has been referred to as the modified, or lagged dependent variable, Sims test. In contrast to Granger’s test which considers temporal precedence in the form of a link from the past to the present, the modified Sims test considers temporal precedence in the form of a link from the present to the future. As a consequence, the potential causal relationship considered runs from the dependent variable to future values, or ‘leads’, of the regressor. The relevant testing equations are then given as:
(3) 
(4) 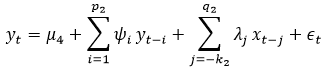
where k1, k2, p1, p2, q1, q2 > 0.
To consider potential causality from xt to yt, the link between the dependent variable xt and future values of y is examined using the leads {yt + k1, yt + k1 – 1,…, yt + 1}. The relevant null hypothesis of no causality from xt to yt (x ⇸ y) is considered therefore via H0: φj = 0 ∀j < 0 in (3). Similarly, the null hypothesis of no causality from yt to xt (y ⇸ x) is examined via H0: λj = 0 ∀j < 0 in (4).
3. Empirical Analysis of the Regional Housing Market
To illustrate the nature of the Granger and modified Sims tests of causality, data available from the EViews file house.wf1 are utilised. This file contains quarterly observations (expressed in natural logarithmic form) on house prices in two regions of the UK over the period 1973Q1 to 2015Q4. The regions considered are East Anglia and London, with the series denoted in the EViews file as ‘EA’ and ‘LON’ respectively. The use of these series provides an interesting vehicle for the application of causality analysis as it allows consideration of the often discussed theory of a ripple effect within housing market under which changes in house prices are said to occur first in London and the South East before filtering out to other regions of the UK. Clearly this theory can be expressed within the present context in terms of a unidirectional causal relationship from London to East Anglia.
To avoid concerns regarding spurious regression, the orders of integration of the series and their potential cointegration were examined ahead of performing the tests of causality. Application of both the augmented Dickey-Fuller (ADF) test and GLS-ADF test failed to reject the unit root null hypothesis for both series.[2] To examine whether the series {EA,LON} are cointegrated, the Engle-Granger method was applied. The results from application of this approach are provided in Table One below. From inspection of these results, it can be seen that the null of no cointegration is not rejected at conventional levels of significance when either LON or EA is employed as the dependent variable in the first stage of the Engle-Granger procedure given the observed p-values of 76.4% and 81.9% respectively.[3]
Table One: Engle-Granger Cointegration Analysis
|
Dependent |
tau-statistic |
Prob.* |
|---|---|---|
|
EA |
-1.498292 |
0.7641 |
|
LON |
-1.340543 |
0.8190 |
As the EA and LON series have been found to be non-cointegrated unit root processes, the analysis of causality between the series proceeds using their first differences. Denoting these first differenced series as DEA and DLON respectively, the Granger and modified Sims tests above are employed using DEA and DLON as x and y. As a means of introducing some robustness with respect to serial correlation and/or heteroscedasticity, equations (1)-(4) are estimated herein using the Newey-West covariance matrix estimator. The results obtained using four lags and, where appropriate, four leads in the testing equations are as given in Table Two below.
Table Two: Granger and Modified Sims Causality Tests
|
Null |
Granger |
Modified Sims |
||
|---|---|---|---|---|
|
F-stat |
p-value |
F-stat |
p-value |
|
|
DEA ⇸ DLON |
0.494 |
0.741 |
0.678 |
0.608 |
|
DLON ⇸ DEA |
4.368 |
0.002 |
2.369 |
0.055 |
From inspection of Table Two, it can be seen that strong evidence in support of unidirectional causality from London to East Anglia (but not vice versa) is present with the null of no causality rejected at conventional levels of significance when considering London as the causal region, but not when considering East Anglia as the causal region. In addition, the results show the Granger and modified Sims tests produce quantitatively, albeit not qualitatively, different findings as a result of their different structures. While both tests show no evidence supporting the rejection of the null of East Anglia not causing London, there is a slight difference in their findings for causality in the opposite direction. More precisely, rejection of the null of London not causing East Anglia is comfortably rejected at the 5% level using Granger’s test (the p-value is 0.2%), but is not rejected at this level using the modified Sims test although this is marginal (the p-value being 5.5%).
4. Conclusion
The current case study has attempted to supplement textbook presentation of causality analysis using a practical application which illustrates the use of the two leading tests of causality in relation to a topical economic theory. Via the provision of the data analysed, the findings presented can be replicated and variations upon them considered as a result of considering, inter alia, alternative lag structures or covariance matrix estimators. In addition, as a result of its inherent nature, the analysis of causality presented requires consideration of unit root and cointegration analyses, and consequently the data provided can be employed to consider these topics for teaching purposes.
References
Cook, S. (2008) ‘Further analysis of spurious causality’, Mathematics and Computers in Simulation, 79, 647-651. https://doi.org/10.1016/j.matcom.2008.04.011
Geweke, J., Meese, R. and Dent, W. (1983) ‘Comparing alternative tests of causality in temporal systems: Analytic results and experimental evidence’, Journal of Econometrics, 21, 161-194. https://doi.org/10.1016/0304-4076(83)90012-X
Granger, C. (1969) ‘Investigating causal relations by econometric models and cross spectral methods’, Econometrica, 37, 424-438. https://doi.org/10.2307/1912791
Sims, C. (1972) ‘Money, income and causality’, American Economic Review, 62, 540-552. JSTOR 1806097
Footnotes
[1] Instantaneous causality can be viewed as controversial or problematic in the sense that causality by its very nature implies a form of temporal precedence.
[2] The tests were performed using an intercept and linear trend as deterministic terms with the degree of augmentation of the testing equations determined using the modified AIC.
[3] Similar to the unit root testing above, consideration of the cointegration between the series provides a further use for the current data for teaching purposes.
↑ Top