Embedding Sustainability in the Economics Curriculum: Boxes
This page contains extended examples, educational materials, and resource suggestions to supplement the Handbook chapter "Embedding Sustainability in the Economics Curriculum".
Box 1: Sustainability: what is to be done, and by whom?
It is easy to stimulate discussion of views of sustainability around one or two issues of wide concern such as climate change, water resource shortages or marine acidification. A starting point might be to set students in groups to prepare an assessment of one or more of these problems to present to the class. Then, after each presentation, ask the class as a whole "what can be done about it?"
Usually, a range of positions emerges ranging from "no growth" through to "science will find a solution". The technologies discussed most change, but recurring types involve huge solar generation projects, electric transport, technologies that capture carbon emissions as they are produced, and even large-scale geoengineering schemes that suck already existing carbon emissions out of the atmosphere. Technological solutions such as these remain unsurprisingly popular as they support the notion of perpetually increasing prosperity. Adair Turner (2020) recently made the case for technological optimism. Of course, "science" is not an amorphous blob, it involves researchers working in firms and universities, various sources of funding, and households using (or not) the products of science.
So, that discussion suggests another question: "who do you think should be responsible to tackle the issues?" When students are asked this question, they often respond "Government", via its various policy tools to manage growth or invest in infrastructure, or indeed via supporting technological change. However, firms can make significant changes to production processes and supply chains, so are also important agents. Finally, some economists focus on individual households changing their behaviour, although clearly again this raises the question of how; and if part of the story is that households are nudged to change (see Barile, 2022), this raises the question of who is doing the nudging, Government, business, or some other agent?
Box 2: an extended circular flow of income
The circular flow of income is a foundational tool in economics and is typically found in introductions to macroeconomics. The typical circular flow model presents flows of income, expenditure, goods and services between groups of economic actors. The version below is highly simplified, collapsing government and import sectors into ‘businesses’.
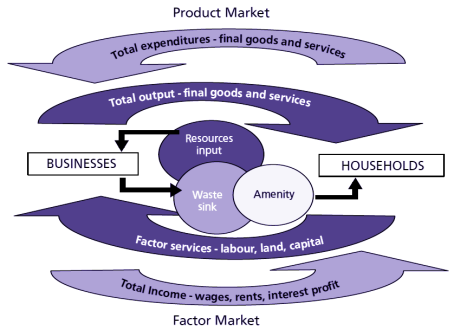
One way to deliver this is to take the standard circular flow and ask students to add items. This can be a rich exercise, not least in helping students think about model building: initial attempts to extend the model can lead to extremely complex models that are more realistic but intractable. The final version seen above might be viewed as over-simple but can be argued to be a good representation in terms of capturing key processes.
Box 3: Cost-Benefit Analysis and Multi-criteria analysis
Cost-benefit analysis is an approach very commonly used in environmental valuation (see Box 4) and decision-making. However, it is perceived as being limited, using a single standard of value. Hence, Multi-Criteria Analysis, which will be discussed below. First, we consider CBA via a case study of a tourism development in Minorca, which can be used a classroom exercise, or as a homework assignment to be discussed in class. With software available, students can construct their own CBA using CBA Builder (see Box 9). It is an application of investment appraisal, that introduces core concepts such as one-off capital and recurring current expenditures, discounting, private (and social) costs and benefits.
The study compared the provision of 1000 bed spaces in an extensive villa-style development with concentrated high-rise resort development. The tables below show financial inflows and outflows, as well as capturing external (social) costs, for the two options.
Table 1: calculations for the Villa case. Net present value = £−1.34m per 1000
| Year | Inflow (Profit £m) | Outflow Capital £m | Outflow Extern £m | Net Flow £m | Discount Factor | Net DCF £m |
|---|---|---|---|---|---|---|
| 2004 | 6.50 | 35.00 | 1.54 | −30.04 | 0.9091 | −27.31 |
| 2005 | 6.50 | 1.54 | 4.96 | 0.8264 | 4.10 | |
| 2006 | 6.50 | 1.54 | 4.96 | 0.7513 | 3.73 | |
| 2007 | 6.50 | 1.54 | 4.96 | 0.6830 | 3.39 | |
| 2008 | 6.50 | 1.54 | 4.96 | 0.6209 | 3.08 | |
| 2009 | 6.50 | 1.54 | 4.96 | 0.5645 | 2.80 | |
| 2010 | 6.50 | 1.54 | 4.96 | 0.5132 | 2.55 | |
| 2011 | 6.50 | 1.54 | 4.96 | 0.4665 | 2.31 | |
| 2012 | 6.50 | 1.54 | 4.96 | 0.4241 | 2.10 | |
| 2013 | 6.50 | 1.54 | 4.96 | 0.3855 | 1.91 | |
| TOTAL | 65.00 | 35.00 | 15.40 | 14.60 | −1.34 |
Table 2: calculations for the high-rise case. Net present value = £0.93m per 1000
| Year | Inflow (Profit £m) | Outflow Capital £m | Outflow Extern £m | Net Flow £m | Discount Factor | Net DCF £m |
|---|---|---|---|---|---|---|
| 2004 | 2.50 | 15.00 | 0.13 | −12.63 | 0.9091 | −11.48 |
| 2005 | 2.50 | 0.13 | 2.37 | 0.8264 | 1.96 | |
| 2006 | 2.50 | 0.13 | 2.37 | 0.7513 | 1.78 | |
| 2007 | 2.50 | 0.13 | 2.37 | 0.6830 | 1.62 | |
| 2008 | 2.50 | 0.13 | 2.37 | 0.6209 | 1.47 | |
| 2009 | 2.50 | 0.13 | 2.37 | 0.5645 | 1.34 | |
| 2010 | 2.50 | 0.13 | 2.37 | 0.5132 | 1.22 | |
| 2011 | 2.50 | 0.13 | 2.37 | 0.4665 | 1.11 | |
| 2012 | 2.50 | 0.13 | 2.37 | 0.4241 | 1.01 | |
| 2013 | 2.50 | 0.13 | 2.37 | 0.3855 | 0.91 | |
| TOTAL | 25.00 | 15.00 | 1.30 | 8.70 | 0.93 |
The students tend to think that villa-style development is more sustainable, and the IA shows that it provides a much greater private NPV. However, the external costs that are included in CBA show that the high-rise concentrated development generates a greater social NPV. This is largely due to the very great infrastructure cost of providing utility services and access to developments spread all over the island, together with the greater land take, energy consumption and water demand associated with villas each with their own swimming pools and air conditioning systems.
Of particular relevance to sustainability is discounting. There is an argument that intergenerational equity implicit in the resource-based view of sustainability demands a discount rate of zero. A valuable discussion of the theoretical basis of discounting can be based on issues of inflation, risk and time preference.
CBA leads naturally into the evaluation of environmental impacts (see above) The potential contribution of CBA to deciding macro policy priorities was illustrated in the Stern Review (Stern, 2006), in which it was the key methodology for assessing the benefits of intervening to reduce carbon emissions and thus to reduce the likelihood of further global warming.
Multi-Criteria Analysis (MCA)
MCA offers an alternative to CBA when evaluating multifaceted projects, especially those with considerable local impact. It allows a degree of democracy in deciding what impacts matter most and should be given most weight in decision making. It is less effective in deciding on projects with national or global level benefits to be set against local costs. It then can allow local interests to dominate. However, MCA offers scope for classroom exercises, as in the example below.
The class was asked to compare two possible courses of action: a resource tax and a carbon tax. The resource tax is an incentive to encourage organisations to move towards a circular economy. Resource taxes tax resource rents over and above the levies implicit in general income taxes, whereas carbon taxes are raised on an organisation’s audited CO2e greenhouse gas (GHG) emissions. For both options, a performance matrix can be devised, like the one below. A short form of this exercise would take the evaluations as read, but the class could, for instance from existing literature, build up the performance matrix, including deciding on its criteria.
Table 1: performance matrix
| Type of tax | Impact on GHG emissions | Impact on biodiversity | Impact on local communities | Equity and fairness | Cost of implementation |
|---|---|---|---|---|---|
| Resource tax | Modest reduction | Fairly large positive effect | Some positive, some very negative effects | Unfair to some nations | Modest |
| Carbon tax | Large reduction | Modest positive effect | Some large positive effects | Fairly uniform impact | Very high |
The next stage of the process is criteria scoring. Criteria must be scored to give a numerical value, which in the case below are entirely fictional. Below a simple –10 to 10 scale is used but there are alternatives. Again, discussion points for students include how the scale might make a difference to the outcome, and how the scores are arrived at.
Table 2: criteria scoring
| Type of tax | Impact on GHG emissions | Impact on biodiversity | Impact on local communities | Equity and fairness | Cost of implementation |
|---|---|---|---|---|---|
| Resource tax | 2 | 7 | 2 | −3 | 4 |
| Carbon tax | 9 | 2 | 4 | −1 | 9 |
Third, the criteria must be weighted. Weights adding up to 100 must be decided. A key element is here is that individual students arrive at their own weights and then compare with their neighbour before the whole class tries to reach a consensus. This process often generates quite divergent results, again providing ample opportunities for further discussion.
Finally, the weights and criteria scores are combined to arrive at final scores for each option. The example below shows the effect of choosing equal weights between criteria. This is usually the democratic aspect of the process of MCA. This lends itself most to classroom discussion as little case-specific technical expertise is required. Equal weights are assumed for illustrative purposes but should use the weights derived from class discussion. Again, this can be used to explore the robustness of the scores and the potential implications of that.
Table 3: final stage scores
| Type of tax | Impact on GHG emissions | Impact on biodiversity | Impact on local communities | Equity and fairness | Cost of implementation | Total |
|---|---|---|---|---|---|---|
| Weight | 20 | 20 | 20 | 20 | 20 | 100 |
| Resource tax score | 2 | 7 | 2 | −3 | 4 | |
| Carbon tax score | 9 | 2 | 4 | −1 | 9 | |
| Resource tax score x weight | 40 | 140 | 40 | 40 | -80 | 80 |
| Carbon tax score x weight | 180 | 40 | 80 | -20 | -180 | 100 |
Box 4: Sustainability as a macro-economic issue
One of the longest running debates in Economics is about how to conceive of the macroeconomy. Classical economists, whilst recognising individuals acted, focused their analysis on system-level outcomes and tendencies, such as population, growth and profit. Accordingly, they used class analysis and focused on shares to distributive classes as important drivers of the system. With the advent of marginalism came individualism and the notion that the economy is merely an aggregation of individuals, who, could be captured in terms of an average, representative individual. In the 1930s the idea of collective categories such as consumption and investment expenditures, which may or may not be aggregates, became key explainers of economy-level phenomena. However, over time such models got edged out by general equilibrium models. Despite some model pluralism in the 1970s, the computable general equilibrium and dynamic stochastic general equilibrium models began to dominate. Whilst large economic decision-makers such as the Bank of England employ a suite of models, at the heart of their decision process is a large complex DSGE model. In the area of climate change economics, a variant of this approach has also dominated: Integrated Assessment Models (IAM) try to capture the complexity of interacting complex environments, including the economy. A large assortment of IAM models exists (see UN 2022). Many of these models capture the economy via large general equilibrium models. For example, Nordhaus has developed his DICE (Dynamic Integrated Climate Economy) models which attempt to incorporate environmental damage. However, Nordhaus has been criticised for claiming that an increase of average global temperature of 4 degrees C above pre-industrial levels can be ‘optimal’, which is well out of line with climate scientists’ projections (Keen, 2019).
Ecological economists have developed alternatives to these DSGE approaches, arguing that the representative agent approaches underplay the complexity of individuals. In response, agent-based models have been developed which allow individuals to respond in slightly more complex ways than merely being assumed to move almost automatically to a utility-maximising outcome. Also, critics feel the DSGE’s smooth responses to external shocks, back to equilibrium via price adjustments, are unrealistic. Victor (2008) developed a Keynesian model, LowGrow, with a specific treatment of forestry.
Most recently, Stock-Flow Consistent (SFC) models inspired by the work of Godley and Tobin (see Nikiforos and Zezza, 2018) have been developed, which claim to integrate rigorously the real, financial and ecological dimensions of the economy. The basic notion of SFC models is that, echoing input-output models, expenditures by each sector are incomes of other sectors; and, echoing balance sheets, financial assets of each sector are financial liabilities of other sectors, and vice versa. These models have been augmented to include principles of thermodynamics (see for example, Dafermos et al, 2015), allowing the integration of real, financial and ecological dimensions. One such example is the LowGrowSFC model discussed in Box 9.
Beyond these, still, are fundamentally different visions of the economy, including the doughnut approach of Kate Raworth (see section 2.1). The circular economy is another notion, albeit one that is contested, focusing on the reuse of materials and avoiding waste. It has been promoted actively, for instance by the Ellen Macarthur Foundation and adopted by some large firms, although it has been criticised for being too focused on environmental performance to the neglect of the socio-economic (Geissdoerfer, et al 2017). The foundational economy is the concept that there is a set of universal basic services that are provided, and that these should be done via an extended public provision (see Gough, 2019); however, the foundational economy is not seen as a single unified block, and that services are needed differently in different contexts. In the terminology of Bayliss and Fine (2020), indeed, systems of provision vary geographically but also sectorially, and are characterised not only by supply chains but by material cultures that sustain and organise demand as well as supply. These systems are argued to require urgent reformulation in order to be more sustainable, but will typically act to resist what may be desirable demand reductions.
Box 5: Valuation
Cost benefit analysis (CBA) is a common point at which to introduce the valuation of environmental assets. However, CBA has been criticised for failing to evaluate environmental impacts, merely describing them in physical units. Over the past 30 years, methodologies for evaluation in money terms have been evolving, although these are not widely used as they have proved expensive and unreliable. Nevertheless, it is often argued that it is better to have some monetary evaluation rather than a physical measure that is not included in the net present value and thus easy to ignore. The application of valuation techniques has been given a boost recently by attempts to evaluate ecosystem services and 'green infrastructure' by central and local government (see for example www.greeninfrastructure.org.uk).
Total economic value of natural capital
Discussing total economic value (TEV) with students as an introduction to evaluation encourages reflection on the meaning of value in economics. Some, for example, use the idea of the total willingness to pay (TWP), the logic being that the value of a particular resource use can be measured in terms of the sacrifice that people are willing to make to have the resource. At the most general level, this sacrifice is in terms of income, therefore TWP makes sense as a measure of economic value to the individual. This does not come without limitations, which is worth mentioning to students. Indeed, we need to accept that this measure is sensitive to changes in the distribution of income (for a discussion see Tietenberg and Lewis, 2018). TEV is generally made up of use value and non-use values. Use value can be direct where, for example, a lake is used for fishing, or indirect, where it provides the setting for a pleasant walk. Non-use value is usually divided into categories representing different ways in which a natural asset may bestow value (e.g., option value, quasi-option value, existence (or intrinsic) value, bequest value, and altruistic value).
Evaluating environmental impact
Environmental costs often occur because of the destruction or degradation of environmental assets or by causing pollution. For example, building a new road will interfere with natural drainage, cause pollution of watercourses, and act as a barrier severing wildlife habitats. It will result in noise and congestion to local communities in the construction phase. It will continue to have an impact on amenity by causing noise and pollution subsequently. In many cases, the impact will reduce the use value of the asset. Direct use may be associated with a marketed output and the reduction in this is the basis for evaluating impact. Indirect use may also be marketed where entrance fees are charged. Where there is no money transaction, it is difficult to estimate the demand for environmental goods and services. One way of doing so, is to think about the demand for a particular good as the WTP for the good. Economists have found some clever solutions to estimate the WTP for environmental goods and services. Some of them estimate the WTP looking at individuals’ actual behaviour, some others draw inferences from the demand for related goods, and some others use survey data to infer the WTP.
More generally, a distinction is made between revealed and stated preference methods. Revealed methods focus on actual and observable choices, where market prices are inferred directly or indirectly from human behaviour. Stated preference methods use survey analysis to elicit individuals’ WTP (their stated preferences) for environmental gains (or to prevent an environmental loss) and their WTA the absence of an environmental gain (or to compensate for an environmental loss).
Typically, the most discussed methods of evaluation are:
- Contingent valuation method (CVM) elicits values from a representative sample of an appropriate population by describing a context where an environmental asset is (usually) destroyed. Respondents are then asked how much they would be willing to pay (WTP) to preserve the asset or how much they would be prepared to accept in compensation (WTA) for the loss. Contingent valuation methods and the concept of WTP and WTA give instructors an opportunity to run the ‘mug experiment’ (see Kahneman et al., 1990) and discuss the impact of loss aversion, as a manifestation of the endowment effect (i.e., the idea that losses loom larger than gains), on the WTP/WTA gap which has important implications for public investment appraisal and CBA. Unique among valuation methods, CVM can capture all the components of TEV. However, as many other stated preferences methods, CVMs are subject to various limitations pertaining survey analyses (e.g., strategic bias, information bias, starting point bias, and hypothetical bias to mention some).
- Travel cost assumes that the expense of travelling to visit an environmental asset is a good proxy for a price for the benefits of the visit. By surveying a sample of visitors to the asset and collecting travel cost and other socioeconomic data, it is possible to generalise to the total population of visitors and construct a demand curve for the benefits flowing from the asset. The method only captures use value. A simple way to introduce travel cost methods is to provide an example of a touristic site that students might be familiar with (e.g., Stonehenge in the UK).
- Hedonic pricing uses the variation in the prices of dwellings or remuneration levels associated with different environmental conditions as a source of evidence of the WTA for tolerating those conditions. The most frequent application has been the variation in house prices with proximity to some nuisance (such as aircraft noise from an airport) or some environmental asset (such as a riverside location). Storytelling could be a very engaging way to introduce hedonic pricing methods, especially for year 1 UG students. Think about the possibility of showing students the video of dowisetrepla from the famous TV series ‘How I Met Your Mother’. In this episode ‘Down Wind of the Sewerage Treatment Plant – dowisetrepla' the two main characters sadly discover that the house they recently bought was close to a sewage treatment plant, thus revealing why the real estate agent wanted them to view the house only over the weekend, when the plant was shut down. In terms of how to apply the technique, hedonic pricing requires collecting house price data in the area, together with house and neighborhood characteristics that might also influence price. Econometric estimation of a house price function will allow the component of the price associated with the environmental attribute of interest. This is the basis for deriving a WTP or WTA associated with the attribute. Again, this method only captures use values.
A detailed discussion of each of these methods, their operationalisation and limitations can be found in standard textbooks (e.g., Tietenberg and Lewis, 2018; and Hanley et al. 2013). Suffice it to say that, as the number of studies has built up, the range of values for similar assets has been disturbingly wide, suggesting serious reliability issues.
Box 6: software and resources for embedding sustainability in economics teaching
Various software packages can be useful in facilitating teaching sustainability, both from the broadly macro- and broadly micro-economic perspectives. Here we discuss a few; however, new packages are developing all the time, so what we show is a mere snapshot.
LowGrow is a computer simulation of a macroeconomic model for Canada developed by Victor (2008). The model is an aggregate demand-aggregate supply framework – marrying a typical Keynesian expenditure function with a conventional production function. However, the model has several novel features that make it useful for teaching sustainability. The model has outcomes for conventional macroeconomic variables such as unemployment and growth but in addition tracks greenhouse gas emissions, forestry and poverty. This last element addresses the aspect of sustainability concerned with equity. A further central feature is that, as the name LowGrow suggests, the model examines low growth scenarios.
Students can interact with the computer model by changing key policy variables and witnessing the outcomes. Furthermore, the model has several pedagogically advantageous features. Most of its variables and policy tools are quite conventional, so students familiar with typical macroeconomics syllabuses can easily adapt to the model. Further, Victor (2008: ch. 10), in conjunction with Victor and Rosenbuth (2007), explains the model in detail. He shows how the model can be represented graphically and in equation form. Victor also discusses the econometric work underlying the calibration of the simulation model. LowGrow therefore has several aspects that make it excellent for teaching, at many levels.
More recently, reflecting developments in macroeconomic modelling discussed elsewhere in this resource, Peter Victor and Tim Jackson have updated LowGrow to become LowGrowSFC, a stock-flow consistent model in the heritage of Godley and Lavoie (2006). The interactive resource allows one to explore the four scenarios laid out by Jackson and Victor (2020) – ranging from a base case scenario to one of net zero carbon sustainable prosperity. In addition, one can create one’s own scenarios, which is pedagogically the resource’s most beneficial element, as it allows students to discuss the possible impact of a set of relevant variables, see their changes play out in the model and discuss why this happens, and discuss the nature of the model and, even more broadly, uses of modelling itself.
CBA Builder (Wheatley, 2011) is an Excel-based program designed to allow the user to conduct a cost benefit analysis, together with a sensitivity analysis. The software has several features that make it a useful resource for teaching. It is quite user-friendly and has an accompanying manual containing information on the calculations it performs. Hence it can be used as a tool for reinforcing concepts such as discount rate, net present value and more general concepts such as short and long-run costs. It can therefore be used as an investment appraisal tool. However, by adding in data on externalities CBA Builder can be used for environmental analysis. The sensitivity analysis allows students to understand contingency, which in turn fosters their ability to use judgement and caution in policy decisions. The other benefit for students is in terms of employability: Excel is regarded as a highly useful tool and CBA Builder allows them to develop further their competence in it. CBA Builder has received positive feedback from users.
Several spin-offs have been developed around the concept of the doughnut. One such example is an interactive version, which allows users to explore the parameters of the doughnut. Finally, there are various carbon footprint calculators (e.g., giki Zero, WWF calculator, and MacKay Carbon Calculator), which can be used to give students a general idea of how their daily-life behaviour help generating GHG emissions, reflect on the link between human actions and pollution emissions and think about workable solutions to adapt their actions to live in a more sustainable way.
The Resources and Energy Analysis Programme (REAP) software, developed by the Stockholm Environmental Institute at the University of York, enables students to engage with several sustainability issues relating to lifestyle. The current consumption patterns across the UK based on MOSAIC data are used to derive area sustainability profiles in terms of ecological footprint in global hectares, carbon footprint in tonnes and footprints of a range of other pollutants. Geographical areas down to district level can be accessed or new study areas created by aggregating districts. REAP is conceived as a policy instrument whereby local authorities can try out different policy scenarios covering areas such as transport, housing and population growth, and gauge the footprint impact.
A workshop that engages students can be based on their own home district. Overseas students can choose an area they have visited. Initially, students can be asked to find a series of footprints relating to their areas. These can be compared in group discussion and some reasons for differentials suggested. As a second stage, students can enter the scenario mode of the software and try policies which might reduce footprints in their areas. It is a sobering exercise for students to try and evolve policies that bring the ecological footprint down to the sustainable level of 1.8gha.
Experience with using the software suggests that it is best to start with an introductory group session in a PC lab, defining the metrics and investigating home area profiles. The scenario capability of REAP should be introduced and then students set the footprint reduction exercise to be completed in their own time.
The Stockholm Institute has many resources in addition to REAP, including tools for understanding commodity footprints for an extensive range of goods, as well as specific tools for examining key commodities such as steel, or key natural resources such as water. They also provide tools for decision-making, and others which facilitate systems thinking and anticipatory thinking identified as ESD skills.
Box 7: Environmental and ecological economics approaches
Economic treatments of sustainability are diverse; however, as a heuristic the distinction drawn here between environmental and ecological economics approaches might be useful. Given time, a discussion of the distinction can be useful in understanding the concepts as well as helping students develop critical and contrastive thinking capacity.
| Environmental economics | Ecological economics |
|---|---|
| ‘Mainstream’ approach rooted (in general) in neo-classicism, emphasising rationality, optimisation economics, and efficiency. Recent behavioural insights question rationality assumption. | More affinity with heterodox, non-orthodox economics, emphasising power, change and social nature of the economy |
| ‘Economy–first’ approach. Applies economics to the environment. | ‘Ecology-first’ approach. Draws on natural sciences. |
| Efficient allocation of scarce environmental resources. | Scale crucial. Efficiency and distribution also important. Importance of equity. |
| Predictability of the long run (at least probabilistically) | The long term is inherently uncertain. The long term is paramount. The precautionary principle applies. |
| Microeconomic emphasis | Macroeconomic or holistic or systemic emphasis |
| Analysis is value-free: there are no over-riding moral imperatives | Analysis is inevitably value-laden: there can be a moral imperative to protect the environment, other species, etc., as well as a survival imperative. |
| Markets are generally efficient and produce socially-optimal economic outcomes. Market and exchange solutions to economic problems are emphasised. Public goods do represent problems. | Markets are social institutions, which might or might not (generally thought not to) produce so-called optimal economic outcomes. |
| Externalities emphasised. | ‘System’ approach makes nothing ‘external’. |
| Government intervention might be a necessary evil in some cases (e.g. public goods). Proper allocation of private property rights should solve most problems. | Government is on the whole inevitably necessary to intervene in markets, which will not generally work, and to negotiate international treaties on climate, etc. |
Many of the concepts in the left-hand column of Box 6 are familiar to most economists, being derived from standard theory. A typical course on environmental economics might look something like the left-hand column. Another variant is to deliver ‘natural resource economics’ in which both renewable and non-renewable resources are considered. Ecological economics is a somewhat younger branch of the discipline (see Spash, 2017). The focus is more on approaching ecological processes than from an economic perspective. Two names are particularly prominent in ecological economics: Herman Daly and Robert Costanza. They demonstrated the immense value of natural systems by attempting a monetary valuation of them, and the total value they derived dwarfed the value of other inputs into economic systems (Costanza et al., 1991). Daly also proposed a steady-state economy in the sense that it operates to avoid further ecosystem degradation but rather enables natural systems to recover (Daly, 1991). There is considerable overlap in the subject matter of ecological and environmental economics. The key difference is one of orientation: environmental economics tends to embrace the neo-classical paradigm as an analysis of the economic system and seeks to incorporate environmental assets and services into that behavioural model. The objective is to maximise economic welfare. Ecological economics gives priority to the health of complex interrelated ecological systems and considers how economic behaviour can be modified to that end.
Box 8: Campus walk and living labs universities
It is essential that students see concrete examples of sustainable and non-sustainable design and practice. Case studies can be useful in this regard, as can an assessment that requires the students to go out to evaluate actual organisations. A useful place to start is on one’s doorstep: the campus. Many educational institutions have made recent efforts to be more sustainable, often through energy efficiency measures which can generate financial savings. So, one would expect to be able to find many examples of sustainable buildings and processes on university campuses. Start in the classroom. Ask students to look around and identify sustainable and non-sustainable objects or design features. Students will note double-glazed windows, motion sensors, thermostats and even carbon dioxide sensors, the amount of natural light entering the room, and the number of electrical appliances, for example. Leaving the classroom, students can observe how corridors are lit and heated, whether doors and windows are closed, and how frequently they spot a recycling centre, for example. A campus with some design innovations assists in this task, as students may see – or be invited to see – smart heating and lighting systems, electricity generation or water heating from solar panels, integrated drainage systems, improvised wildflower and wildlife areas, and innovative spaces that are naturally lit and facilitate social activities that enhance social sustainability. All of these are potential cases for cost benefit analysis.
Pedagogically these campus walks are also valuable. There is a significant element of active learning present. Clearly the tutor must act as a guide and plan a route that is likely to have items of interest on it. The instructor must also be open to surprise finds and consequently odd questions. The students must be sufficiently knowledgeable to be able to spot relevant features; so, it may not be advisable to schedule the campus walk early in the year. However, as part of a PBL approach, students may be directed to a feature of the campus with particular sustainability issues. Instead, or as well, the university or campus itself could be the problem object to be studied. Such an approach allows students to be more engaged with the topic, and with their campus. It may be that an unforeseen consequence of this activity is that students do things on campus that they otherwise would not. If there is flexibility in assessment, these new student activities could themselves become objects for analysis. For example, students could film their own campus walks, perhaps as group activities, and then show them to their peers.
More recently, the pressure to embed sustainability within the HE curriculum has seen the development of a living labs approach to sustainability. This provides not only opportunities to develop a more sustainable campus but allows also staff and students to work collaboratively and co-create solutions to real-life issues, encouraging students to apply their knowledge to a real-world context. The use of a living labs approach to sustainability is not as widely used as it can- or should-be. Most universities now recognize that there is a need to train students to be prepared for the global challenges that we are all facing. The recent Covid 19 pandemic taught us that the world is changing, and we require new ways of thinking, acting and treating ourselves as a community of life. Education has the potential of fostering social transformation processes, but in doing so, we may need to reorient and strengthen the role of educators and education to build more just, sustainable, and peaceful communities where to live. This means universities require innovative sustainability pedagogical methods embracing experiential learning to allow students to become global and responsible citizens equipped with the skills needed to solve the challenges that they will encounter in their future careers. As a result, we might need to abandon traditional pedagogical methods that over-simplify real-life and complex trade-offs and decision-making processes into right/wrong answers. A more holistic approach to sustainability is essential here: skills like systems thinking, future thinking, and cross-disciplinary competencies rooted in sustainability thinking become fundamental in this transition. The case studies in Section 7 provide examples of best practice of more holistic approaches to sustainability.
Box 9: classroom games for embedding sustainability in economics teaching
Classroom games have been identified as a way of engaging students with economic concepts. Some existing Economics Network resources explicitly address sustainability issues. Others can be adapted.
Copestake and Ellum discusses a climate change game that can be played in different formats to allow for different levels of economic knowledge and different levels of complexity in the game. The game explores concepts such as public goods and the iterated Prisoner’s Dilemma to explore some of the economic issues connected to climate change negotiations and compliance. The game can also enhance students’ transferable skills by employing Excel spreadsheets. As always, such games can be adapted to take into account different theoretical frameworks. In this case, the game rests on theoretical presuppositions, such as the simple self-interest of nations. Tutors might wish to explore that presupposition and the consequences of abandoning it. On the same topic, the BBC has designed a climate change game, which could be used to explore the issues around climate change negotiations and compliance.
Sloman (2002) discusses an international trade game in which some countries are natural resource rich and others may have more manufactured capital. That allows for the immediate discussion of types of capital and their substitutability. The purpose of the game is then for each country to engage in trade to its national advantage. The game is designed to allow ‘shocks’ to occur, so it is an easy adaptation to introduce into the game ecological shocks, perhaps through the forms of resource price spikes, and to investigate their consequences. Guest (2007) discusses a set of games with implications for sustainability, including on public goods, auctions and trading. These latter two are important in a sustainability context because of the growing importance of emissions trading, carbon permits and other market-based carbon reduction schemes.
The Economics Network resources also contain several games that are more general but again have uses in courses on sustainability. Sloman (2009) discusses an expected value game based on the television programme Deal or No Deal. Clearly this game has applications for sustainability, for example in the notion of risk. This can be extended to discuss non-probabilistic risk and the concept important in sustainability of the precautionary principle. Sutcliffe’s (2002) press briefing game and Piggott’s (2003) journalistic writing assignment are useful in the context of sustainability given its inevitable political dimension and the importance of communicating findings on sustainability effectively to the public.
The paper aeroplane game, discussed by Mearman, has some similarities to the tennis ball game discussed by Guest and by Hedges (2004). This is a game originally designed to illustrate diminishing marginal returns in production, but is easily adapted to explore aspects of sustainability. The game asks students to make paper aeroplanes in groups in which increasing numbers of students are involved in production. In the basic form of the game, it is expected that marginal productivity would eventually stop increasing. Students can explore how design of the product and of the production process can affect productivity. There are several sustainability angles on this. Students may consider how efficient the process may appear if energy use is taken into account. Students may also debate the extent to which waste is produced in the process. Students could discuss the likely sources of raw materials and the associated sustainability issues. They might also consider product design and the potential for remanufacture and maintenance of the product. One of the principles of cradle-to-cradle production (McDonough and Braungart, 2002) is that the product should be produced where possible from recycled materials, and that there should be no waste from the production process.
Classex offers additional games that can be played with students with reference to sustainability and/or climate change. To give some examples, there is a fish pond game that links to the tragedy of the commons (Hardin, 1968) and resource overexploitation; there are various public good games (with/without punishments) that, using experiential learning, can help introducing the non-excludable and non-rivalrous characteristics of public goods; and there is a coal market game offered as part of the CORE Project, where students can familiarise with Pigouvian taxes and permits as possible solutions to a negative externality problem.
The Financial Times has recently introduced the FT Climate Game: Can you Reach Net Zero?, which essentially aims at reducing GHG emissions from the current 36bn tonnes a year to net zero by 2050 and brings to life a decision-making process that is often seen abstract and complex by citizens. The game consists of asking a set of questions focused on four different sectors (energy, transport, building and industry) mainly responsible for GHG emissions as evidenced by the International Energy Agency (IEA)’s Net Zero By 2050 report (IEA 2021). The players need to decide the best course of action to reduce emissions by 2050, and in doing so they face a trade-off between costly effort (increasing when 2050 is looming) and CO2 emissions reduction. In playing the game, students can experience a sense of control over their actions and get an understanding of how things interact within the process, dealing with the complexity and uncertainty aspects of sustainability issues and developing systems and future thinking competences.
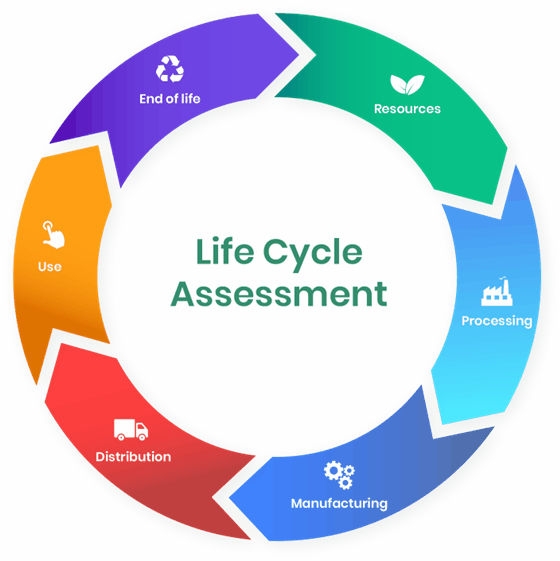
Box 10: Life-cycle assessment (LCA)
LCA, via Carbon Accounting, gives a useful framework for analysing the impact on sustainability of a particular product, by considering the GHG emissions associated with a particular product. It is sometimes formulated as “Cradle to Gate” which includes all impacts up to the point of dispatch from the manufacturing facility, or alternatively “Cradle to Grave” which includes all stages in the products’ life including distribution, use and eventual disposal. Two diagrammatic representations are shown below. The first diagram represents the basic interpretation of LCA.
Figure 1: Life Cycle Assessment. Source: https://www.oneclicklca.com/life-cycle-assessment-explained/
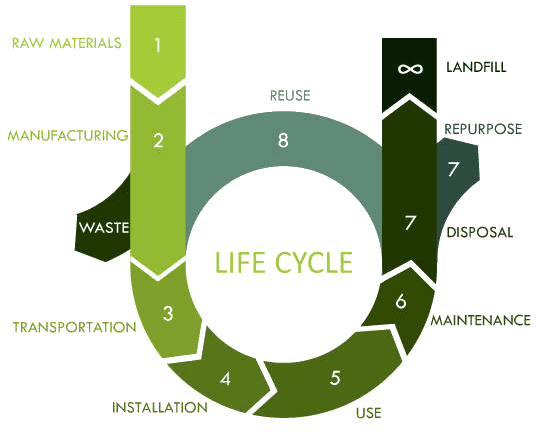
The second (Figure 2) shows an adaptation to include some aspects of the Circular Economy (see Figure 3 further below).
Figure 2: LCA with application to the circular economy. Source: Shaik Khaja Mohidin (2018)
The LCA provides a suitable introductory exercise asking students to consider the social and environmental impacts of a particular product such as an Electric Vehicle (EV). A further teaching idea is to use the interesting, though dated, online software package, the Economic Input Output Life Cycle Assessment (EIOLCA) model developed by Carnegie Mellon University. The software combines LCA and Economic Input-Output analysis to provide a sector-based model for estimating the impact of a stimulus in a particular sector of the (US or Canadian) economy. Unfortunately, this is a 2008 vintage creation and applies to the US economy but nevertheless is valuable for understanding the relationship between the economic stimulation of a sector and the associated environmental impact (including GHGs, air pollutants, energy use and water demand). It is easy for students to make use of the model with little guidance and can form the basis of a valuable seminar activity. It would be ideal for the tutor to access the model description and underlying assumptions by clicking on the documentation tab on the website. She or he would then be better able to answer student questions.
LCA and the circular economy
One way of introducing elements of the circular economy into LCA is to refer to the RESOLVE framework below.
Figure 3: the RESOLVE framework. Source: McKinsey's Centre for Business and the Environment
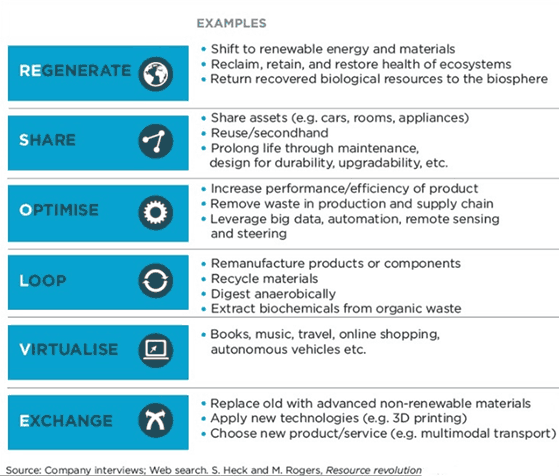
The circular economy concept lends itself to several class exercises and discussions: for example, a discussion based on the relevance of the concept for a service-oriented economy such as the UK; alternatively, a discussion based on the barriers to the adoption of the CE in advanced economies.
↑ Top