

We present a simple simulation model, implemented in Excel, that can be used to develop the concept of optimal tariffs, and as the basis of an experimental assignment on the effects of tariff retaliation. By exploring the simulation, students are able to discover for themselves the potentially deleterious effects of a trade war, and that a trade war will not result in the elimination of all trade.
The benefits of using Excel in economics education have been widely discussed in the literature, both in the context of model development (Cahill and Kosicki, 2000; Mixon and Tohamy, 2000), and in terms of building a skill set of considerable practical value in the business world (Wight, 1999). While much of the literature is concerned with principles, a number of applications to international economics have also been considered (Tohamy and Mixon, 2003; Gilbert, forthcoming). Hence, Excel has become an established medium of instruction in the international economics classroom.
This paper extends the trade policy side of the literature by presenting an Excel-based, partial equilibrium trade model that can be used to help develop the concept of optimal tariffs/export taxes, and that can form the basis for a simulated a trade war between two economies. The latter is an important and, given current events, timely topic, which is often only lightly covered in international economics texts.
Excel is pedagogically valuable in terms of providing an alternative medium with which to present models, in both tabular and graphical form. It also allows a semi-experimental approach to be undertaken. The sheet and assignment used in this project are set up in a way that allows students to ascertain a number of important results for themselves, prior to classroom discussion. In this way Excel can be used for discovery in addition to reinforcement. This approach has proved very successful in terms of student understanding, and has allowed students to take ownership of the results (and hence be convinced by them) in a way that does not always occur with classroom demonstration.
In the following section, we review the motivation for this model. We then develop the theoretical foundation for the optimal tariff and retaliation (an appendix sets out the tariff reaction function in more detail). Implementation in Excel is then discussed briefly and this is followed by a discussion of the trade war simulation assignment, learning objectives and student response. Concluding comments follow.
In March 2002 the Bush administration decided to impose temporary safeguard tariffs on steel products. This move has provided an excellent real-world example with which to motivate classroom discussion of several tariff policy issues, including the distributive effects of tariffs, the concept of deadweight loss and optimal responses to noneconomic objectives. In late 2003 the World Trade Organization (WTO) ruled on appeal that the steel tariffs violated trade rules, both because of the failure to prove that the US steel industry was under severe threat from imports, and because NAFTA partners were exempt from the tariffs while included in the calculation of harm.(note 1)
This opened the way for US trading partners, including the EU, Japan and Korea, to retaliate, which they immediately threatened to do. The USA responded by withdrawing the safeguards, claiming that they had achieved their intended purpose.
These developments encouraged us to construct an experimental/simulation model to allow students to explore the consequences of a tariff war for themselves. This important topic is often not developed fully in undergraduate texts, usually relegated to a footnote following discussion of the optimal tariff. However, it is critical to student understanding of the limitations of the optimal tariff argument, the potential damage caused by a trade war, and the role of institutions such as the WTO in trying to achieve and sustain a global free trade equilibrium.
As a familiar environment for most students, which allows integration of both numerical and graphical methods of model presentation, Excel was chosen as the tool to implement the simulation.
While the classic article by Johnson (1953) uses a general equilibrium model to develop the concept of tariff retaliation, similar results can be obtained in a partial equilibrium setting. For undergraduate classes in international economics, this has considerable advantages. Principally, the simple approach allows the tedious topic of offer curves to be avoided, and is in keeping with the predominantly partial analysis of trade policy found in undergraduate texts (e.g. Husted and Melvin, 2003).
Let there be two economies, Home and Foreign, with the latter distinguished from the former by an asterisk. Let Home demand and supply be:
QD = QD (p)
QS = QS (p)
where dQD /dp < 0 and dQS /dp > 0. Assume that Home is the importing economy. The import demand function is:
QM (p) = QD (p) – QS (p)
implying that dQM /dp < 0. Similarly, we may define the export supply function of Foreign as:
Q*X (p*) = Q*S (p*) – Q*D (p*)
where dQ*X /dp* > 0. A free trade equilibrium requires that p = p* (the arbitrage condition). Following Dixit and Norman (1980) and using Home notation, market clearing then implies:
QM (p) = Q*X (p)
which can be solved directly for the market clearing price, leaving the quantity of trade to be determined by (3) or (4). The free trade equilibrium is illustrated by the intersection of the excess demand/supply curves in Figure 1.
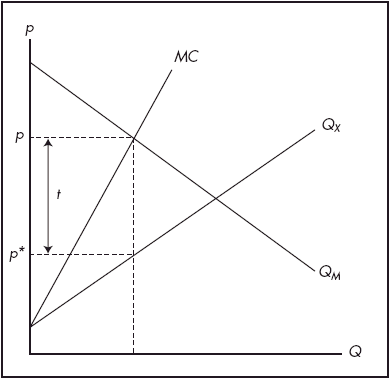
Suppose that free trade represents the status quo. Consider the incentives of Home. In the free trade equilibrium, the marginal benefit of imports is equal to the average cost of imports (i.e. p = p*). Optimal policy, however, requires that the marginal benefit equal the marginal cost. It is easily shown that the marginal cost of imports is equal to MC = dC/dQ*X = p* + Q*X (dp*/dQ*X) where C = p*Q*X. Hence optimal policy in Home requires:
p = p* (1 + 1/ε*)
where ε* is the elasticity of foreign export supply. That is, Home has an incentive to impose an optimal tariff (acting as a monopsonist). In terms of Figure 1, the optimal tariff is t. A similar argument could be made for Foreign.
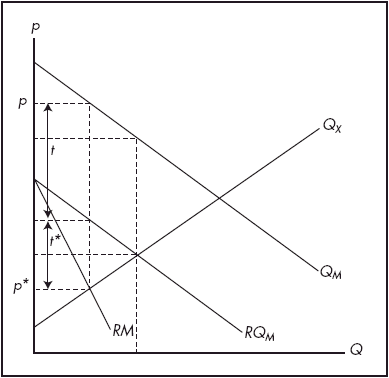
Given the Home tariff, it is in Foreign’s interest to respond with an export tax.(note 2) Hence, taking the Home tariff as fixed, Foreign may choose its own optimal export tax. This step is shown in Figure 2 (where the original marginal cost curve is omitted for clarity). Foreign is assumed to reason that the Home tariff (t) will remain, and so imposes an export tax of t* (the optimal export tax given the residual import demand). This process can proceed in turn, with each country taking the intervention of its trading partner as given at each stage. The war ends when neither country has an incentive to alter its trade policy.(note 3) This is similar to a Cournot game in industrial economics, and indeed it can be approached and solved in the same way – by forming ‘tariff reaction functions’ (see Appendix 1).
The model and analytical procedure could be implemented in a variety of ways in Excel. One possibility is to directly solve the model fully in the sheet itself. If non-linear functions are used and finding explicit solutions is difficult, the Solver add-in could be used. We use linear functions for demand and supply, for simplicity. Because our objective is to provide a mechanism whereby students can discover the consequences of a trade war for themselves, we only partially solve the model within the sheet. Trade policies remain exogenously specified, leaving the determination of the optimal tariff at any stage a manual exercise.
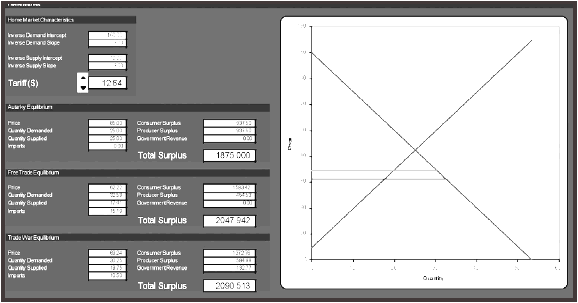
The interface for the Home economy is shown in Figure 3. The Foreign interface is similar, but is parameterized such that the autarky price lies below that of Home. The instructor can set the parameters of the (inverse) demand and supply functions for each economy.(note 4) The initial tariff and export tax are set to zero. Because Excel incorporates the use of forms, we set up ‘spinners’ to allow students to easily increase or decrease the magnitude of the policies at a steady pace. The excess demand and supply functions, and the equilibrium solutions (for autarky, free trade and trade war) are calculated directly, as are the welfare components (consumer and producer surplus, and government revenue) – see Figure 3.
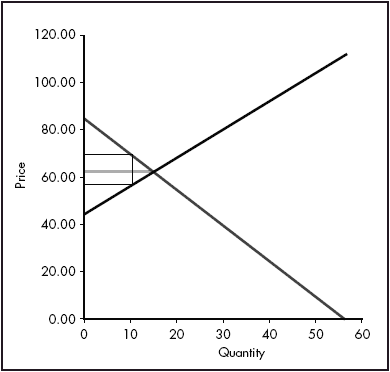
Because Excel integrates calculation with graphical capabilities, it is a straightforward matter to construct diagrams representing the equilibrium in each domestic market (see Figure 3) and the world market (see Figure 4), particularly if linear functions are utilized. Because these figures are ‘live’, they respond directly to changes in the parameterization of the model, and update in response to changes in the policy instruments in each economy.
This model is used in a lower division class in international economics for business students. Students are given access to the Excel spreadsheet via a class website, and assigned instructions on the nature of the experiment that they are to undertake (see Appendix 2). They have been exposed to the sheet previously in the classroom, where it is used to demonstrate the optimal tariff (in a single stage). Their task is essentially to simulate a retaliatory trade war. Students are not told what to expect. In order to provide structure to the assignment, they are asked to record certain values as they proceed, and to write a short essay describing their results, and what they discovered through the process.
The trade war is initiated by finding the optimal tariff tax for the Home economy using the spinners. As students increase the tariff, they find that government revenue and producer surplus at first rise rapidly, while consumer surplus declines. Total surplus increases, but at a gradually decreasing rate. Eventually, total surplus declines, and a small backward step yields the optimum.5 In essence, by undertaking this process, students are tracing across a tariff iso-welfare map in trade tax space, searching for the point of tangency with the home tariff axis, representing a zero foreign export tax (see Figure 5). In other words, they are identifying a point on Home’s tariff reaction function. Students note at this stage that total surplus has increased relative to free trade in Home, but at the expense of the trading partner.
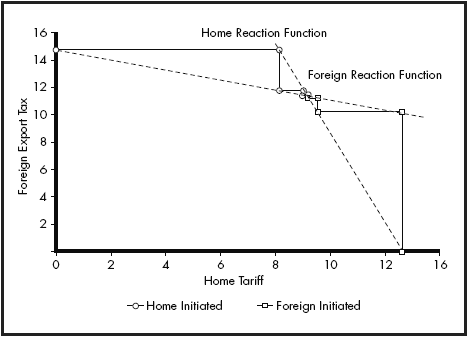
The second stage of the game is Foreign retaliation. Students are asked to leave the Home tariff in place and find the best foreign response in the same manner as above. They find that the Foreign economy is able to regain some of the loss from Home’s tariff, and in doing so Home welfare falls well below free trade levels. Thus it is in Foreign’s best interest to respond, and Home’s initial benefits are eroded.
The third stage is the one that students have found most surprising. Before working through the experiment, students generally expect that the war will escalate. As students increase the Home tariff, however, they find that Home surplus declines. In fact (under our hypothesis for the existence of the war), Home’s best response to Foreign retaliation is to back down, lowering its tariff. (The response of the USA to the threat of retaliation in the current dispute is enlightening here.)
Students are asked to repeat several more stages of the war. They find that at each stage the adjustments become smaller, quickly reaching a point where it is not possible for either country to raise/lower its tariff/export tax to its advantage. A Nash equilibrium in the trade war game has been found. The tariff reaction functions are plotted in Figure 5. This result emphasizes several important points. First, both countries lose from the trade war relative to free trade.6 The ‘optimal’ tariff argument must be interpreted in the light of potential foreign reaction. Second, since each country has an incentive to alter its policy at the free trade point, free trade is clearly not a Nash equilibrium. The WTO and its rules may then be usefully discussed in terms of trying to sustain (or achieve) a non-Nash equilibrium. Third, by alternating the country that initiates the trade war, students can find that the equilibrium outcome is independent of the initiating economy. Fourth, and perhaps most important, the equilibrium eventually achieved still involves trade. This is another result that many students find genuinely surprising. The expectation of most students, in line with the escalation hypothesis, is that a trade war will lead to autarky. The fact that this is not the case can be used to reinforce the basic gains from trade concept that some trade is always superior to none.
Student reaction to this experiment has been very positive. Several students noted that this was ‘the most convincing argument [they] had seen against government intervention in trade’, and a large number of others indicated that this was the assignment that they enjoyed most (out of five writing assignments over the semester) and from which they felt they had learned the most.
Excel provides a familiar and almost universally available environment in which to implement economic models. In our experience, Excel has proved to be particularly useful for setting up simulations that allow students to discover important results for themselves. We have found that this improves classroom discussions and interest in the subject matter considerably. The model here is a tariff war. We have successfully used a similar approach to analyse the consequences of growth in a trading partner (in a general equilibrium framework), and will continue to develop new models in the future.
If the Home demand and supply functions take the form:
QD = αD – βD p
QS = αS – βS p
the Home excess demand function is then:
QM = (αD – αS) – (βD + βS)p
Similarly, the Foreign excess supply function is:
Q*X = (α*S – α*D) – (β*S + β*D)p*
From here we can construct inverse excess demand and supply functions:
p = δD – γDQ
p* = δ*S + γ*SQ + t*
where δD = (αD – αS)/(βD + βS) and γD = 1/(βD – βS), etc., and t* is any export tax imposed by Foreign. Note that we have imposed the equilibrium condition QM = Q*X = Q. Multiplying (A1.6) by Q yields the total cost of imports for Home. Hence marginal cost is:
MC = δ*S + 2γ*SQ + t*
Since at any optimal choice for Home, price must equal marginal cost, using (A1.5) and (A1.7):
δD – γDQ = δ*SQ + t*
which yields:
Q = (δD – δ*S – t*)/(2γ*S + γD)
This can be substituted into (A1.5) and (A1.6) to solve for the Home and Foreign price. Since the Home tariff is defined as the difference between the two prices, we have:
t = γ*S(δD – δ*S – t*)/(2γ*S + γD)
This is Home’s tariff reaction function. Foreign’s reaction function can be derived in a similar fashion.
Download the Excel sheet entitled ‘Trade Wars’ (the assignment version) from the class website. Your task is to simulate and describe a trade war in steel between Home and Foreign. In this game, each country imposes optimal trade taxes on the other in turn.
Conduct the following experiment:
Summarise what you have found in this experiment. Include the optimal taxes and welfare levels at each stage in your description. What are the implications of your findings for the likely outcomes of real-world trade wars? Your response should be approximately 300 words, preferably typed. You may also use diagrams/numerical examples and/or properly cited evidence to support your arguments.
1. For an excellent overview of the case, the debates under the WTO, including a full timeline, and estimates of the costs of the policy, see Hufbauer and Goodrich (2003b). Details of the rationale for the intervention and problems in the US steel industry can be found in Hufbauer and Goodrich (2003a).
2. Some students might query why Foreign uses an export tax. It may be useful to note that by the symmetry theorem (Lerner, 1936) an import tax and an export tax are the same thing in a two-good model. Hence, the export tax could reflect an import tariff in some other (unobserved) market.
3. As Johnson (1953) demonstrates, it is possible to have an unstable Nash equilibrium, in which case the two economies find themselves in a repetitive cycle of raising and lowering their barriers to trade.
4. In this sheet and in others that we have developed, we use the convention of indicating cells, the values of which can be changed (parameters and exogenous variables) in white, while using grey to indicate values that change according to the model solution (endogenous variables).
5. The ‘grid search’ approach, while certainly not the most direct method other solution, works well with undergraduate students, who may have only limited calculus and appreciate the interactive quality.
6. It is possible, depending on the parameters of the model, that one, but not both, of the economies will ‘win’ the trade war.
Cahill, M. and G. Kosicki (2000) “Exploring Economic Models Using Excel” Southern Economic Journal 66:770-792
Dixit, A. and Norman, V. (1980) Theory of International Trade: A Dual, General Equilibrium Approach, Cambridge: Cambridge University Press.
Gilbert, J. (forthcoming) ‘Using nonlinear programming in international trade theory: the factor-proportions model, Journal of Economic Education.
Hufbauer, G. and Goodrich, B. (2003a) ‘Steel policy: the good, the bad, and the ugly’, International Economic Policy Brief PB03-1, Institute for International Economics.
Hufbauer, G. and Goodrich, B. (2003b) ‘Next move in steel: revocation or retaliation?’, International Economic Policy Brief PB03-10, Institute for International Economics.
Husted, S. and Melvin, M. (2003) International Economics (6th edn), Boston, MA: Addison Wesley Longman.
Johnson, H. G. (1953) ‘Optimum tariffs and retaliation’, Review of Economic Studies, 21, pp. 142–53.
Lerner, A. P. (1936) ‘The symmetry between import and export taxes’, Economica, 3, pp. 306–13.
Mixon, J. W. and Tohamy, S. (2000) ‘Using Microsoft Excel in principles of economics’, Computers in Higher Education Economics Review, 14(2), pp. 4–6.
Tohamy, S. and Mixon, J. W. (2003) ‘Lessons from the specific factors model of international trade’, Journal of Economic Education, 34(2), pp. 139–50.
Wight, J. B. (1999) ‘Using electronic data tools in writing assignments’, Journal of Economic Education, 30, pp. 21–7.
John Gilbert
Assistant Professor
Department of Economics
Utah State University
3530 Old Main Hill
Logan, UT 84322-3530
USA
Tel: 435-797-2314
Fax: 435-797-2701
Email: jgilbert@econ.usu.edu