

However, using programs such as GAMS and GAUSS to illustrate the benefits of AGE modelling often just serve to add to the difficulty of understanding an already complex subject, since these programs are far from user-friendly and are quite difficult and extremely time-consuming to operate.
A potential way to ease the teaching of AGE modelling is by using TK SOLVER PLUS. This software may be suitable for teaching AGE models since (a) it is not too expensive (Ł395), (b) it comes conveniently on one 3 1/5 inch diskette, (c) it is straightforward to use in the context of AGE models, with two to three keyboard strokes at most needed, and (d) it contains an efficient on-line help facility to rescue the lone student experimenting late at night.
As a suggestion on how to use TK SOLVER in teaching I provide an example based on hypothetical data.
To implement an AGE model one needs a consistent database. A Social Accounting Matrix (SAM) is an example of such a consistent database and can be defined as a numerical representation of the economic cycle. A SAM therefore embodies the "only fundamental law" of economics, namely that for every expenditure there should exist a corresponding income. The following SAM was constructed (since it serves to teach the most important concept).
Table 1: Extremely Simple SAM (all figures in Łmillion)
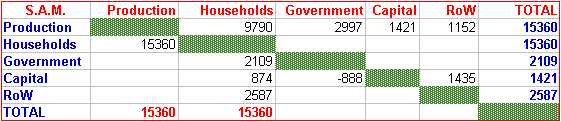
Some of the most basic principles of SAMS can be explained with the help of Table 1. For instance, the convention that all income of institutions is received alonga row and all expenditure incurred down a column. In the atble households, as the owners of production factors such as capital and labour, receive in row 2 the amount of Ł15360 million. The way it is spent is shown down column 2, namely Ł9790 million on final consumption, Ł2109 million on taxes to the government and Ł2587 million on imported goods. The balance, Ł874 million, is saving.
      (1)    Y  = C + I + G + X

      (2)    C =  a + b.YD

      (3)    YD = (1-t).Y

      (4)    GS = t.T - G

      (5)    X  = XBAR - .RER

      (6)    M =  MBAR + .YD + .RER

      (7)    FS = M - X

      (8)    I = FS + GS + (YD - C - M)
In these equations standard notation has been used. Y = income, YD = disposable income,
t = tax rate, RER = real excahnge rate, XBAR = autonomous exports, MBAR =
autonomous imports, FS = foreign saving, GS = government saving. Apart from equations
(2), (5) and (7), all the expressions are identities, a characteristic that this model has in
common with other aggregated macroeconomic models, such as the IMF Polak model, which
is one of the models that have been applied most frequently in the world.
For the elementary static model, as illustrated in this paper, the student need only know two keyboard strokes to use TK SOLVER: the "/" stroke, to invoke a side menu of command options for use within a window, and the "=" stroke, to jump from the variable to the rule sheet and vice versa.
The "Rule Sheet" is where equations are entered. Equations are entered as they appear on
the page, with the exception that multiplication uses the computer's asterisk. Equations are
entered one under another, by pressing
Once all the equations have been entered the screen should look as in
Table 2.
Table 2: Screen shot of Rule Sheet in TK SOLVER Using the "=" command the user should now jump to the variable screen.
All the unknowns in the model, including the parameters, will be listed in
the order in which they were entered in the Rule Sheet. The Variable
Sheet should look as in Table 3.
Table 3: Screen shot of the Variable Sheet in TK
SOLVER Table 3 shows that the Variable Sheet consists of six columns. The
first column from the left is the "status" column, which is used to
distinguish between endogenous and predetermined/exogenous variables, as
will be shown below. The second column is the "input" column. In this
column the base year values - from the SAM and from calibration - must be
entered. It is also these values for the predetermined variables which are
manipulated for policy analysis.
The "name" column contains the name of the variable, while the
"output"column is reserved for the output following a
perturbation/experiment. The "unit" column can be used to describe the
unit of measurement used, in this case Pounds - in most cases I would
recommend that the students ignore this column since most of the time the
units involved will be obvious from the SAM. Finally the "comment" column
can be used to keep notes, or as I prefer, to copy the coontents of the
"input" column (base year dataset) into. This facilitates comparison with
the "output" column after an experiment has been performed, since TK
SOLVER will erase the original input once an output is generated.
The convention in AGE models is to equate all prices in the base year to 1, so that the RER
is set equal to the base year value. A real exchange rate devaluation is then defined as an
increase in RER and a revaluation as a decline in RER. The other parametersneed to be
calibrated. In TK SOLVER this is done by first entering the values of all the knowns from
the SAM in the input column. All unknowns, to be calibrated, should be set equal to 1 as an
initial starting value. After this has been done, to calibrate for instance a and b, the student
should jump to the Rule Sheet and in the "S" (status) column type "C" (for cancel) next to
each equation, except the one in which a and b appear, namely equation 2.
Now jump back to the Variable Sheet. Because there is now only one equation that is active -
i.e. not cancelled - but two unknowns to be estimated - a unique solution cannot be found.
An assumption needs to be made about either the slope or the intercept of the consumption
function. In the present case, saving is assumed to be small, so that it is assumed that b =
0.9. This value is entered next to be in the input column. Now type in the "status" column,
next to a, "G" (for "guess"). This will ask TK SOLVER to solve for the value of a, given
C, YD and b. To initiate the solver, press the function key F9. In the output column next
to a will appear the value -2135.9. To take it back as an input, go to the status column next
to a and press G twice, to "pull back" a and to cancel the guess status.
In a similar way the values of MBAR and XBAR must be calculated. Here it is suggested
that MBAR be set equal to 1200 to reflect perhaps the country's dependency on imported
consumption items, and that the marginal propensity to import be set at the high level of 0.8
to reflect the import dependency of production processes. A value of -9213.8 will be
obtained if the procedure similar to the case of a is followed. Likewise XBAR is set low,
equal to 200, to reflect the fact that the exports of the country under scrutiny may not be a
necessary good for the rest of the world. The resulting value is found to be -952.
In a way the closure will depend on the view of the modeller as to the binding constraints
in the economy. For example, in some countries the exchange rate is kept fixed.
Alternatively, with a flexible exchange rate, the balance of payments (FS) effectively
becomes fixed.
The internal closure will dtermine the causality between investment and saving. For instance,
it is often assumed that government expenditure is fixed or rigid over the short-run due to
"ratchet" effects. Thus, government saving (GS) - i.e. the governmnet deficit - would have
to adjust in the face of changes in governmnet income. This again will, through equation
(8), determine the level of domestic investment.
With the closure rules specified as RER and G fixed I would suggest that the students re-
arrange the order of the "Names" in the Variable Sheet, with the endogenous variables at the
top, and the closure rules followed by the exogenous variables at the bottom - this is just to
keep track of what is going on. The "Names" can be moved by using the "/" command and
choosing "move" from the menu. The Variable Sheet should now look as follows.
Table 4: Final variable Sheet
As an example of performing experiments on TK SOLVER and justifying the results from
within the model, consider the implementation of a "social wage" policy by government,
aimed at providing social safety nets. The budgetary implication of this policy is assumed to
be that government expenditure (G) increase by 10 percent, from 2997 million to 3296.7
million.
In TK SOLVER this new value for G is entered in the input column next to G. To solve the
model with this new value, press F9. The new values for the endogenous variables appear
in the output column (see Table 5).
In Table 5 only the endogenous variables and the closure rules are shown, since the
exogenous variables (apart from G) are unchanged.
By comparing the values in the output column with those in the comment column, the
macroeconomic impact of the increased government expenditure cn be deduced. It is
noticeable that GDP has increased slightl, by 0.006 percent to 15509. Consequently it is so
be expected that consumption also increase slightly. The more substantial effects are on the
government budget deficit (GS) which increases to 1167.22. Because of higher income,
imports increase slightly, and this widens the balance of payments deficit. This amounts to
an increase in foreign saving, but is not enough to offset the negative effects of increased
consumption and government expenditure on GDP.
Table 5: Screen shot after experiment 1 - a 10
percent increase in G
It is important that students learn that the particular effects obtained from each experiment
depend on the closure under wich it was performed. From Table 5 it can be seen that the
above experiment was performed under the assumption of a fixed exchange rate. How would
the results change if the closure was altered, i.e. under a flexible exchange rate? This can
be done by fixing the balance of payments (FS) at its base year level of 1435 and making
RER endogenous (inserting a "G" in RER's St column). After pressing F9 the screen should
look as shown in Table 6.
The results in the output column of Table 6 reveal that an expansionary fiscal policy has
more beneficial effects if the exchange rate is flexible. Compared to the results in Table 5
it is clear that GDP increases by some ś80 million more. There is also an improvement in
consumption. The larger increase in output leads to larger goverment tax revenue, mitigating
the impact of the social expenditure on the budget deficit. Consequently investment is not
crowded out as much as when exchange rates were fixed. The reason for these benficial
effects is that the greater import demand causes the exchange rate to depreciate (by 1.5
percent) and exports to increase, so that the overall balance of payments is unaffected. Thus,
the beneficial effects of the flexible exchange rate are caused by mitigating the adverse
impact on investment and by increasing exports.
Table 6: Screen shot after experiment 2 -
illustrating the effects of closure
Especially in circumstances where students do not have the background to
be able to learn AGE modelling on GAMS or GAUSS I am convinced that TK
SOLVER can at least help the instructor to create some basic
understanding of AGE modelling.
Wagner, J. (1994) Open-Economy Microeconomics on a PC using
SHAZAM. Computers in Higher Education Economics Review, No 21,
February, pp8-16.
===================RULESHEET===================
S   Rule-------------------------------
    Y =  C + I + G + X
    C = a + b*YD
    YD = (1-t)*Y
    GS = T*Y-G
    X = XBAR - *RER
    M = MBAR + *YD + *RER
    FS = M-X
    I = FS+GS+(YD-C-M)
_______________________________________________
===============VARIABLE SHEET==================
St   Input---Name---Output-------Unit----Comment-----------------
             Y
             C
             I
             G
             X
             C
             a
             b
             YD
             t
             XBAR

             RER
             M
             MBAR
             FS
             I
______________________________________________________________
5. Explaining Calibration
Calibration is the procedure whereby values are assigned to the unknown
parameter and variable values which cannot directly be obtained from the
SAM. In the present case these include a, b, t, XBAR, MBAR and RER. Note
that t, however, can be obtained from calculating from the SAM the ratio
2109/15360 which equals 0.137. From this YD can be calculated.6. Explaining Closure
Apart from the parameters the model entered into the rule sheet contain twelve variables,
namely Y, C, I, GS, X, RER, M, YD, G, FS, MBAR and XBAR. There are, however,
only eight equations. With MBAR and XBAR taken to be predetermined however, there
remains the question as to which two variables will be chosen to be exogenous. This
decision is known as closure.
=================VARIABLE SHEET================
St    Input---Name---Output-------------Unit------Comment
G     15360  Y                                    15360
G     9790   C                                    9790
G     1421   I                                    1421
G     -888   GS                                   -888
G     1435   FS                                   1435
G     1152   X                                    1152
G     2587   M                                    2587
G     13251  YD                                   13251

      1      RER
      2997   G
      -2135  a
      0.9    b
      .137   t
      200    XBAR
      -952
      1200   MBAR
      0.8
      -9213
______________________________________________________________
Note that in Table 4 "G"s have been inserted in the status column next to
each endogenous variable. The student should remember to "uncancel" all
the equations in her rule sheet, by entering "C" again over the current
"C"s. Now she should go back to the variable screen and press F9. If the
calibration and closure have been correctly specified, the base year
solution as found in the SAM. should be replaced in the output column.
This means that the model is ready for experiments to be performed.7. Explaining Simulations
The effects of macroeconomic policies and shocks on the hypothetical economy can now be
simulated by changing the values of the parameters and/or exogenous variables. In principle
all the exogenous variables can be changed simultaneously, and the model solved for the new
equilibrium values of the endogenous variables. The problem with this, as enterprising
students will soon realise, is explaining why the particular results are obtained. Students
should be able to explain and justify all simulation results from within the model itself.
Results are dependent on the theory embodied in the model, so that it needs to be impressed
upon students that AGE modellers need to be highly famliar with economic theory. Indeed,
students will soon realise that AGE modelllers need to be simultaneously a "jack of all
trades".
=================VARIABLE SHEET=================
St    Input---Name---Output--------Unit-------Comment-----------
                Y    15509.112                15360
                C    9905.77                  9790
                I    1154.64                  1421
                GS   -1167.226                -888
                FS   1537                     1435
                X    1152                     1152
                M    2689.91                  2587
                YD   13379.638                13251

       1        RER                           1
       3296.7G                                2997
______________________________________________________________
=================VARIABLE SHEET=================
St    Input---Name---Output--------Unit-------Comment-----------
                Y    15581.12                 15360
                C    9961.68                  9790
                I    1156.44                  1421
                GS   -1157.33                 -888
                RER  1.01501                  1
                X    1166.29                  1152
                M    2601.29                  2587
                YD   13441.763                13251

       1435     FS
       3296.7G
8. Conclusions
In this paper an aggregated standard textbook macroeconomic model has been
used as an example to illustrate the potential usefulness of TK SOLVER in
teaching AGE modelling. More general models - as well as the small open
economy micromodel recently illustrated by Wagner
(1994) in this journal -
can also be implemented on it. It is also possible to run dynamic models
on it, such as the two and three gap models.
Institute for Economics and Statistics
University of OxfordReference