Volume 16, 2004
Estimating A Plane: Economics in the Third Dimension
- Robert S. Rycroft
- Professor of Economics, Mary Washington College, Fredericksburg, VA
Introduction
This paper describes a Web-based computer program called 'Estimating A Plane'. The program creates a three-dimensional 'world'. Within this world a sample of data from the linear model Y = f(X1, X2) can be selected and plotted in three-dimensional space. The program will then estimate the least squares coefficients of the model and graph its geometric representation – a plane. The estimated coefficients can be compared to the 'true' coefficients and the estimated plane can be compared to the 'true' plane.
The program was designed to be used as an in-class demonstration and an out-of-class tutorial for an undergraduate econometrics course to help students understand how the process of estimating an equation by ordinary least squares works. Since the program can select any number of random samples, students can see how estimated coefficients are sensitive to the particular sample chosen. Some samples give good estimates and some give bad estimates. The econometrician usually has just one sample to work with.
The program also breaks through the two-dimensional constraint that economists traditionally have been limited by. It is common for econometrics textbooks to demonstrate ordinary least squares concepts using simple regression models represented geometrically by twodimensional graphs. Demonstrating ordinary least squares concepts using multiple regression models represented geometrically by three-dimensional graphs is not common. Only a few textbooks have included three-dimensional drawings,(note 1) but these graphs are only perspective representations on a two-dimensional surface (namely, the printed page). They are not true three-dimensional representations because the user is not able to 'go behind' the graph or view it from a variety of angles.
In recent years there have been a number of developments in both hardware and software that have made the delivery of three-dimensional content over the World Wide Web feasible. The most important development was the introduction in 2001 of version 8.5 of Macromedia's Director™. Director is a high-end multimedia authoring program that has been an industry leader, if not the standard, for years. With version 8.5 a 3D engine was made available to the legions of software developers who were not hardcore C++ programmers or did not have the resources of a major motion picture studio behind them. The whole package could then be delivered to users via the World Wide Web without the requirement of super high-speed connections.
'Estimating A Plane' was developed using Director 8.5 and is available on the World Wide Web. It can be accessed through http://www.mwc.edu/econ/JEE/EstimatingAPlane.htm . The program requires Shockwave™ Player, a free and nearly ubiquitous Macromedia product.(note 2)
Estimating A Plane
The opening slide (see Figure 1) is a curtain that automatically rises. The user is then taken to a slide (see Figure 2) that defines the model, explains how to navigate the three-dimensional world, and discusses how the program works. The true model is Y = 5 + 3*X1 + 2*X2 + ε, where ε has the specified probability distribution.
Figure 1: Opening Slide
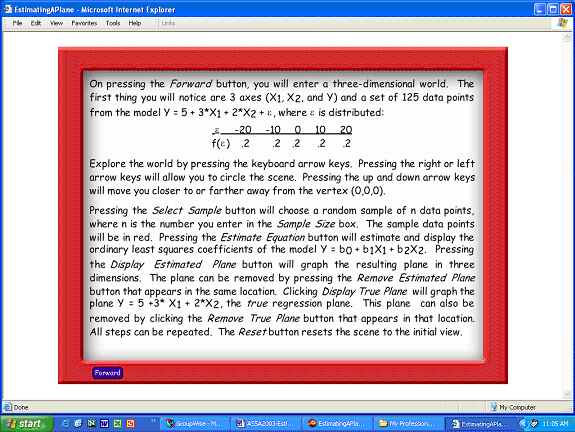
Figure 2: Instructions Slide
After clicking the 'Forward' button, the user gets a first look at the three-dimensional world (see Figure 3). There are axes representing X1, X2 and Y and a set of data points representing the 'population'. The user can navigate this world using the keyboard arrow keys. The user can move left and right and forward and backward.
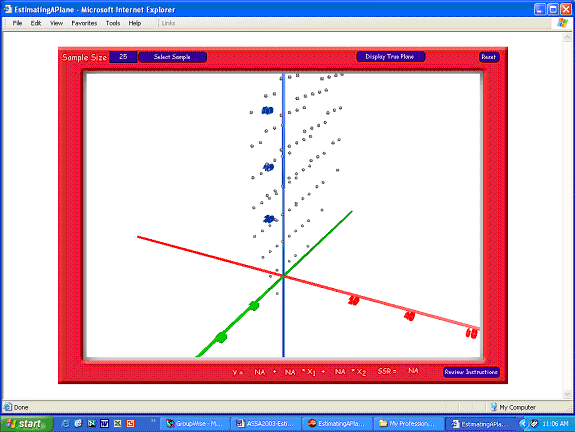
Figure 3: First look at the 3D world
Figure 4 shows the 3D world from a different angle. The left-arrow key was used to rotate around the Y-axis. The down-arrow key was used to move backwards.
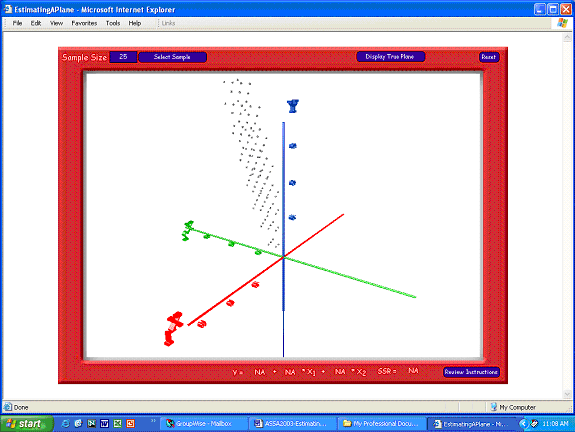
Figure 4: A Look At the 3D World From a Different Angle
To simulate the estimation process, users must select a sample of data. A default n = 25 is already entered in the sample size box (upper left-hand corner), but that can be changed to any number less than 125. Clicking the 'Select Sample' button will randomly choose n points from the population and display them in red. Figure 5 shows one view of a sample of size 25.

Figure 5: A Sample of 25
The user then estimates the equation using the sample by clicking the 'Estimate Equation' button (see Figure 6). The coefficients of an ordinary least squares regression equation (constant term included) are estimated and displayed at the bottom right of the screen along with the sum of squared residuals (SSR). Students can compare the estimated values with the true values.
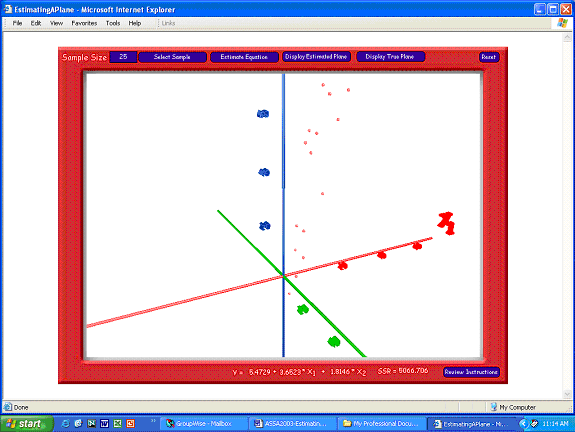
Figure 6: 3D World, Sample, and Estimated Coefficients
Clicking the 'Display Estimated Plane' button will 'draw' the plane that best fits the sample of data (see Figure 7). This plane will be in green.
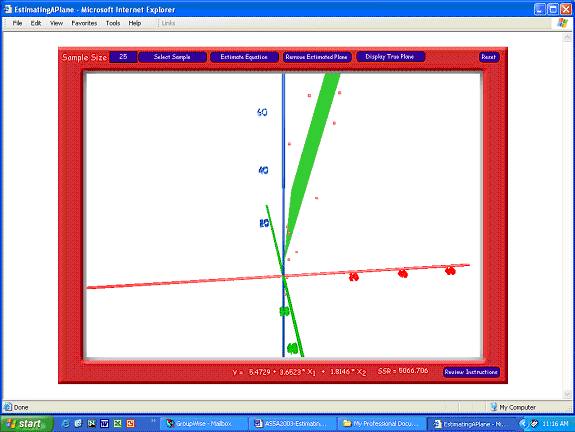
Figure 7: Estimated Plane Displayed
Clicking the 'Display True Plane' button will 'draw' the plane based on the equation Y = 5 + 3*X1 + 2*X2 (see Figure 8). This plane will be red. Students can then see how the true and estimated planes differ.
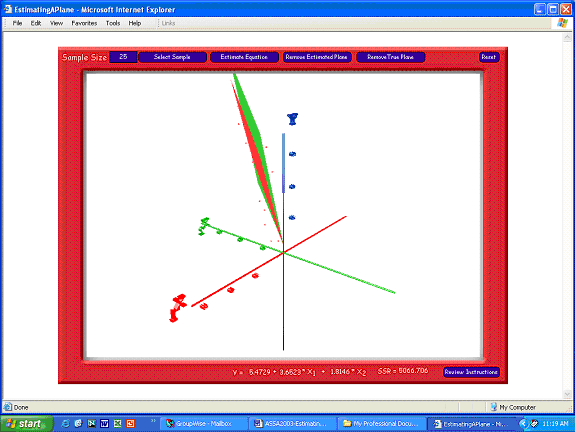
Figure 8: Estimated and True Planes
This procedure can be repeated as many times as desired by hitting the 'Reset' button and choosing new samples.
Conclusion
Basic econometric techniques can be made accessible to students who are not mathematically sophisticated. However, to do that simulation and vivid visual representations must be substituted for rigorous mathematical proofs. This program simulates important concepts associated with ordinary least squares regression and lets the user visualise the process in three dimensions.
There are many concepts from economics that have traditionally been represented by two-dimensional graphs that could benefit from expanding into the third dimension. The theory of consumer choice and the theory of production are two examples. The technology now exists to do just that.
References
Studenmund, A. H. (2001) Using Econometrics: A Practical Guide (4th edn), Boston, MA: Addison Wesley.
Notes
1. One example is 'Figure 2.2 Beef Consumption as a Function of Price and Income' Studenmund (2001), p. 46.
2. If your computer does not have Shockwave Player installed when you attempt to run the tutorial, you will be notified and given the opportunity to link to the Macromedia site and download and install Shockwave. The program is free and installs easily and quickly.
Contact details
Robert S. Rycroft
Professor of Economics
Mary Washington College
Fredericksburg, VA 22401
USA
Tel: 540-654-1500
Email: rrycroft@mwc.edu

