

Secos 4 Windows is the latest version of the established program designed to introduce students to data analysis. As with earlier versions of the program, it is promoted as generic (content-free) software, combining many features from standard spreadsheet and database packages. While users can employ their data, several databases covering a range of economic series are available for teaching purposes. These include data taken from series published by the UK National Statistical Office, the EU and the World Bank. Additional databases cover economic and social history, geography and politics. Using simple menu commands, users can transform and analyse data using common statistical measures and techniques, such as average growth rates or correlation. In addition, it is possible to create a range of graphs to illustrate the data, and they may also generate maps when using certain databases.
Version 3 of Secos constituted a substantial increase in the range of statistical and graphical tools available to users. Wisely, the temptation to add further statistical tools has been resisted and resources concentrated upon adapting the package to its new environment. With some reservations, this adaptation can be judged a success, enhancing an already user-friendly program. Installing the program and the UK Business Trends 1997 and Eureco 2: European Economies 1997 databases under Windows 95 was quick and trouble free. The package is accompanied by a clearly written and concise manual that quickly familiarises the user with Secos’s principal functions.
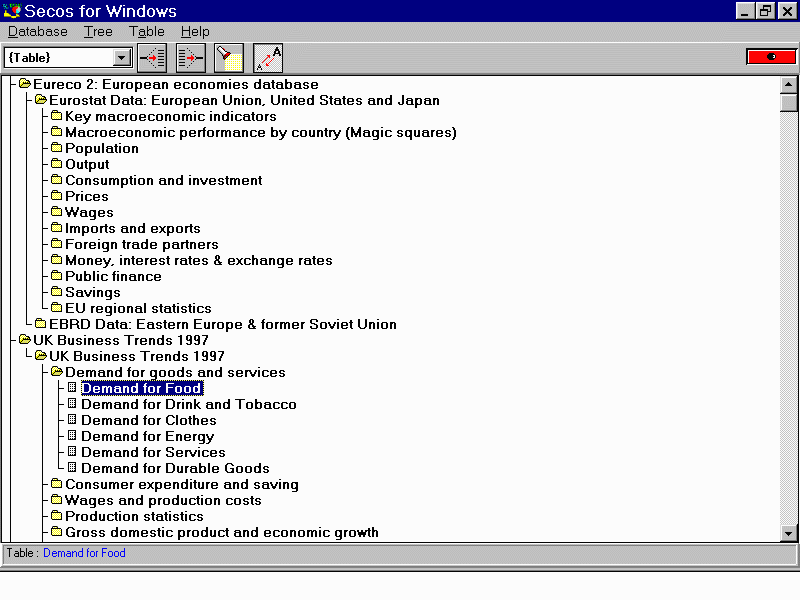
Figure 1. Click on the image to see the full-size version.
The first major improvement in this release over Secos 3 is the Database Manager, shown in Figure 1. Users familiar with Windows will find opening databases and individual tables very straightforward. This is important in a program that will most probably complement traditional lectures and tutorials, allowing little time to instruct users in the program's idiosyncrasies. At this point, it is possible to run through a demonstration database in conjunction with the manual, that introduces the program's salient features. Alternatively, the user can consult the informative Help menus.
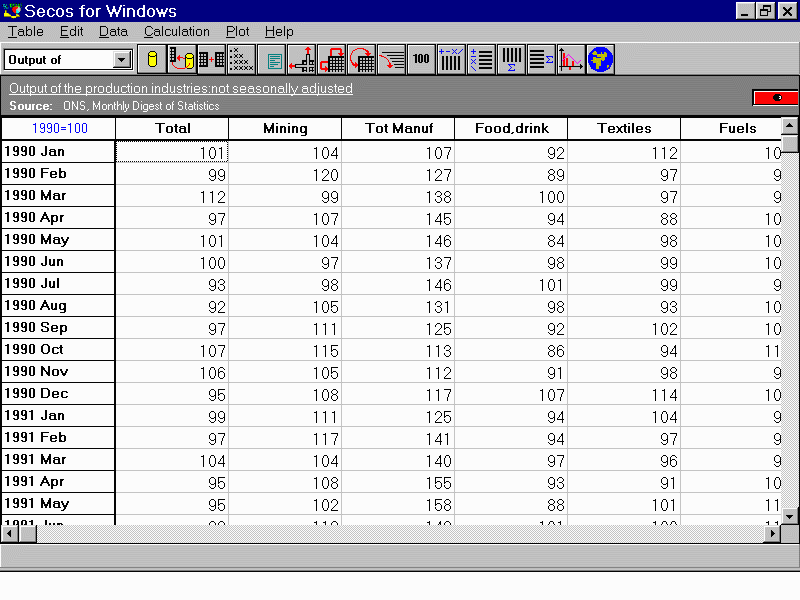
Figure 2. Click on the image to see the full-size version.
Having opened a data table, the user confronts the new-look Secos desktop, as shown in Figure 2. This retains the overall identity of Secos as a cross between a spreadsheet and a database established in Version 3, but greatly enhanced by the flexibility of the Windows GUI. As in previous releases, editing tables, manipulating and transforming data, undertaking calculations and creating graphics are all performed using simple commands from the pull-down menus. Several frequently performed tasks, such as deleted columns of data, can now be performed by clicking on the appropriate icon in the limited but effective toolbar. For certain tasks, such as re-basing an index or determining the range of columns to delete, extra-large special function cursors appear from a red drawer at the top right of the screen. Clicking on the drawer once the task has been completed removes the cursor. Although this looks a little gaudy by comparison with the rest of the package, which otherwise imitates the bland appearance of most business software, it certainly helps focus attention on the task at hand.
Although limited by comparison with professional statistics packages, Secos 4 Windows is still capable of performing quite sophisticated analyses. Users can manipulate and transform the data, changing the frequency of data (from monthly to quarterly, quarterly to annual), change the units of measurement, difference data, change it to logarithmic format and introduce lags. The program will also deal with missing observations. It is possible to calculate a range of descriptive statistics (averages, standard deviation, indices, growth rates, calculate simple correlation coefficients, and calculate linear, moving average and exponentially smoothed trends. In addition, users can define their own simple calculations. The results can be inserted into the table and used for subsequent analysis or graphical presentation. Given the intended user group for this software, students in pre-degree programmes and early undergraduate study in economics and related-disciplines, the analytical possibilities of Secos 4 Windows more than match the knowledge students are likely to possess.
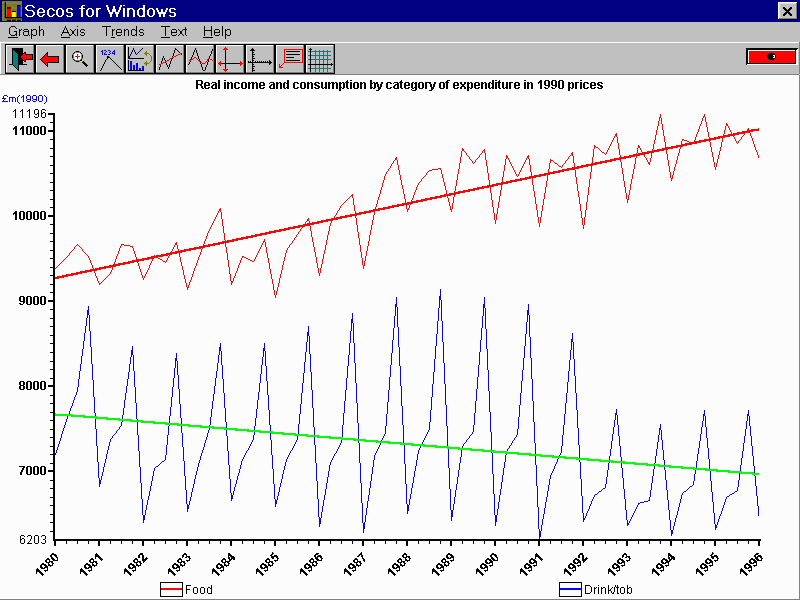
Figure 3. Click on the image to see the full-size version.
With respect to the program's graphics capabilities, users can plot line and bar charts, scatter plots, pie charts (single and multiple), and `magic squares'. It is also possible to plot maps for certain series. Menu commands and toolbar icons allow graphs to be annotated and manipulated, including the addition of trend lines as shown in Figure 3. Once created, graphs can be saved as Windows bitmap files, or copied to the clipboard and pasted into other programs, such as wordprocessors. Although there are few significant additions to the graphics capabilities of this release over the earlier DOS-based Version 3, here as elsewhere the flexibility of the Windows GUI greatly enhances the process of creating, modifying and exporting graphs.
Secos 4 Windows also improves upon the transfer of data to and from other programs. While the process of transferring data from a spreadsheet or database remains rather too idiosyncratic for a Windows-based program for my liking, transferring tables and graphs to a wordprocessor was relatively straightforward. This entailed copying the relevant table or graph to the clipboard using menu commands. Although easy enough, I did find myself consistently searching for the familiar Cut and Paste icons found on toolbars on most Windows programs these days. It would appear that while the program's adaptation to the Windows platform has been a success -- it has run faultlessly since its installation during its review. However, there is still some room for improvement in fully exploiting the possibilities of that environment. This, however, is a minor criticism of what remains an excellent tool for introducing students to data analysis.
Full pricing details are on the web site linked below. Briefly, site licences for either version of SECOS are Ł50 for 20 concurrent users (Ł2.50 each for extra user licences); all datasets are Ł25 each. The SECOS 4 Windows CD-ROM is Ł150 for a 20-user site licence and personal copies are available for staff and students at Ł25, if the Institution has a site licence.
Tel: +44 01279 652183
Fax: +44 01279 506424
E-mail: statsed@dial.pipex.com
Web: http://www.statsed.co.uk/