Volume 11, Issue 1, 1997
GiveWin and PcGive 9.0 for Windows:
a Review
- Guy Judge
- University of Portsmouth
The authors have also taken the opportunity to separate out the PcGive program module (where dynamic econometric models are formulated, estimated and tested) from the GiveWin interface (where users manage their databases, undertake data series transformations and preliminary statistical analysis, and construct pre-regression graphs). Results are also sent to a GiveWin window from where they may be saved or, in a change from version 8.0, immediately printed out. The GiveWin interface will now be common to all program modules in the suite of econometric software available from International Thomson Business Press, so including PcFiml (available only in beta version at the time of this review) and STAMP (the new version of which is due to be released in September this year). This separation of front end from program modules should mean that econometric innovations can more rapidly be introduced into the software as it will not be necessary for the authors completely to rewrite the whole package, only the econometrics module concerned.
Along with the GiveWin package the publishers are also making available a copy of Ox, Doornik's new object-oriented matrix programming language which he has used in the development of the new PcGive. Ox has a syntax similar to C++ and it will allow users with the necessary programming skills to develop their own procedures which they can then use with the GiveWin front end. I shall not attempt to evaluate the use of the Ox language here, but interested readers may wish to refer to the review by Turalay Kenc and J.Michael Orszag in the January 1997 issue of The Economic Journal.
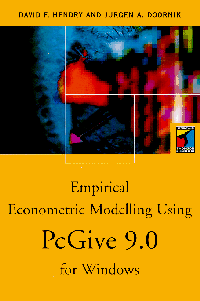
The package supplied to me for review consists of the following: the GiveWin software, the PcGive 9.0 software and the Ox language software (provided on two CDROMs), plus a 294 page book "Empirical Econometric Modelling Using PcGive 9.0 for Windows" written by David Hendry and Jurgen Doornik, and a 352 page manual for Ox. The full PcGive Professional package will also include the PcFiml software and manual when it is ready. In the mean time a beta version can be obtained from Doornik's website. PcFiml is not covered by this review but will be part of the more extensive review planned for The Economic Journal later this year which will update the Judge and Harris (1995) review of PcGive Professional 8.0.
The system requirements for GiveWin and PcGive 9.0 are stated as follows: Intel-compatible PC, preferably running Windows 95 or Windows NT (version 3.51 or newer) but also Windows 3.1 (with Win32S version 1.30 or later). Approximately 10 MB of hard disk space is required. Tests for this review were carried out on a Toshiba Satellite Pro 400 CDT(with an Intel Pentium chip running at 75 MHz) using Windows 95. Installation from the CD-ROM was straightforward and took only a few minutes. The whole process is handled automatically, although you can intervene to alter the recommended default directory for data files.
Users familiar with earlier versions of PcGive will quickly adapt to the new interface provided by the Windows environment. New users will benefit from working through the tutorials which comprise the second part of the book, which is as much a guide to modern econometric modelling as a program manual. The book has a similar structure to that provided with earlier releases, but has been completely rewritten to accompany the new look software.
In trying out the new software I have worked through some of the exercises in Leighton Thomas's new econometrics textbook (Thomas, 1997). Since these exercises relate to single equation dynamic models where one may first wish to examine the properties of the individual data series (or transformations of them) both graphically and by testing for unit roots, follow a general to specific modelling strategy considering especially models expressed in error correction form, apply tests of restrictions and examine diagnostic statistics and graphical output for indications of misspecification, solve for long-run solutions etc., PcGive is eminently suited since it is designed precisely to be used in this fashion.
When you run PcGive, the GiveWin Results window is opened automatically. The first step, of course, is to load the data. This is done in GiveWin either by selecting "File" and then "Open" from the menu or by clicking the "Open File" icon or by using the fast key combination "Ctrl + O". This choice of approaches to the issuing of instructions runs right through the new PcGive and users can adopt the one with which they are most comfortable. Although one can construct a new database in GiveWin, entering values at the keyboard, typically a database will already exist either in ASCII (human readable) form, as a previously created PcGive data file, as a Lotus or Excel worksheet file, or for the first time with this release as a Gauss data file. Here I had an Excel format version of the file already to select and when I did so a Spreadsheet Information dialog box appeared allowing me to confirm the details of the file (observation frequency and sample dates). At this point a new GiveWin window opened showing the data. Although such windows can be hidden or minimised, one must be careful not to close them as the data they contain will then be lost to the program.
The Calculator pad and the Algebra Editor are now both to be found under Tools in the GiveWin menu and these can be used to create new variables based on series already in the database or for generating step or impulse dummy variables. In my case I had to log the two variables C and Y (calling them c and y - lower and upper case letters can be used to represent different series) and then apply the difference operator to generate Dc and Dy.
Still in GiveWin and prior to formulating a general dynamic regression model one can examine the series in more detail graphically, with correlograms, histograms and spectrum plots as well as simple time series plots and cross-plots (scatter diagrams) with simple linear regression lines plotted on them if you wish. You can also create QQ plots which allow you to see how close the distribution of a variable is to normality by showing its transformed cumulative distribution together with that for the normal which appears as a straight line. The properties of these graphs can be edited if required, for example by changing the colour or appearance of plotted lines, adding text or changing the position of the legends shown to identify each series.
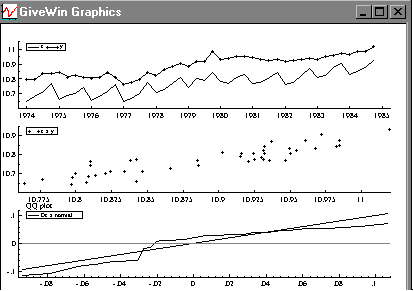
Figure 1 Pre-regression graph plots
Up to 32 graphs can be viewed together in a single GiveWin graphics window and the size of the window itself can be varied by changing the settings in the Working View dialog box. Graphs may now be saved in four formats: WMF(Windows Meta File), EMF (Enhanced Windows Meta File - Windows 95 and Windows NT only), EPS (postscript) and GWG ( a new special GiveWin graph type). The first three can be imported into appropriate software or printed directly. The last is not recognised by any other software but can be loaded back into GiveWin. PCX files are no longer created nor recognised. I sought further explanation from Jurgen Doornik as to why these changes had been made. He replied that the move to a Windows environment provided the ideal opportunity to progress from the old bitmapped graphics such as PCX to a vector graphics standard. However although the Windows vector graphic formats (WMF or EMF) and the postscript files are fine for printing or exporting to another program, neither stores sufficient information for further editing. The new GWG format addresses this issue. The outcome is certainly a major advance in the quality and manipulabilty of the graphics in PcGive.
To conduct unit root tests (or to examine other descriptive properties of the series) one must next switch to the PcGive window. Unit root (ADF) tests may be conducted with constant, trend and seasonals present and the dialog box allows you to set the highest lag length for the lagged differences. Appropriate critical values for the tests are automatically generated by the program and sent to the GiveWin window with the estimated 't' and 'F' values.
Once you are ready to proceed to the dynamic regression analysis select Model and Formulate (Alt + Y or the special formulate icon) and the Formulate Model dialog box opens. Figure 2 illustrates the structure of the dialog box with the available variables in the database shown in the right hand list with those selected to be included in the model shown on the left. The endogenous variable in the regression is marked with an E. When selecting variables to include in the model one can set up a default lag to use for all variables or, by marking Query at the bottom right of the dialog box set the desired lag length separately for each variable.
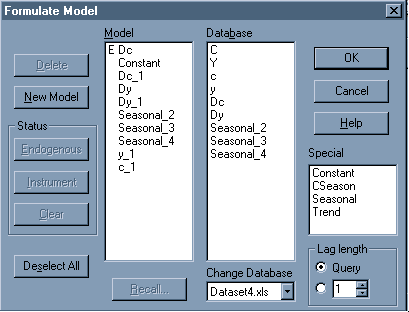
Figure 2 The Formulate Model dialog box
When the formulated model is as you require it select "OK" and you will then be moved to the Estimate Model dialog box (Figure 3). You can select the method of estimation, the sample period to be used and, via the Profile button, any additional statistical and graphical output that you require.
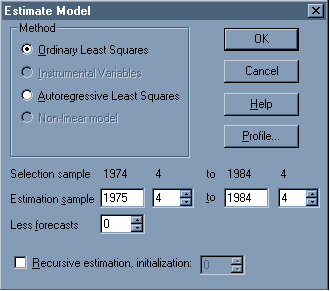
Figure 3 The Estimate Model dialog box
Another dialog box then opens which allows you to compute the static long-run solution , store the estimated Error Correction Mechanism or conduct tests of significance on various terms in the lag structure. A brief message is sent to the PcGive window while the model is estimated. The results are sent to the GiveWin results window. Figure 4 shows what they will look like. (If you want to change the font size or style you can do this from the View menu in GiveWin, although the options are rather limited - you will have more choices if you save the results file and use a word processing package.)
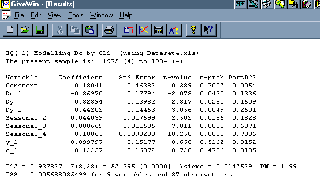
Figure 4 Results in the GiveWin Results window
The Test menu in PcGive offers a variety of diagnostic tests and graphical examination of the results. See Figures 5 and 6 for the dialog boxes and Figure 7 for an example of the graphical output.
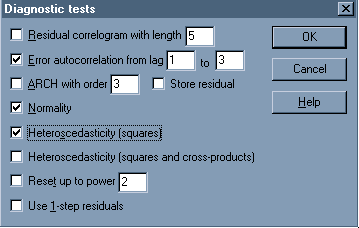
Figures 5 The Diagnostic Tests dialog box
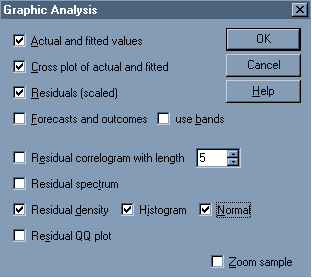
Figure 6 Post-regression Graphic Analysis dialog box
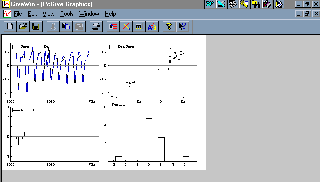
Figure 7 Post regression diagnostic graphics
Thomas suggests simplifying the model by omitting the lagged Dc and Dy terms. Such zero restrictions can be tested by selecting the Test Linear Restrictions: subset option from the Test menu, holding down the Ctrl key when making multiple selections of variables. It is also easy to set up (F) tests of sets of linear restrictions and even (chi-squared) tests of non-linear restrictions which would be relevant, for example, if you wished to test the significance of the long-run parameters in an unconstrained dynamic model.
The tutorial on Model Reduction (Chapter 8 in the PcGive book) provides careful guidance on general to specific modelling and the process of sequential simplification. PcGive allows you to keep track of the progress you make in your general to specific modelling strategy via the Progress Dialog box (see Figure 8). Models based on the same dependent variable and sample period but with different sets of restrictions will be listed and PcGive will give you a progress report based on the Residual Sum of Squares, standard error and Schwartz criterion for each model, together with F tests for each reduction.
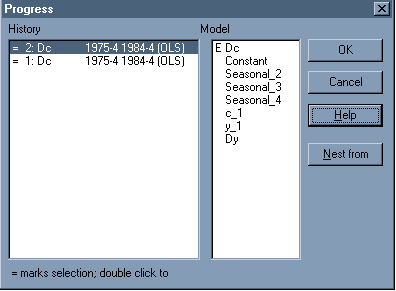
Figure 8 The Progress dialog box
This review has concentrated on the interactive use of PcGive. PcGive programs can also be run in batch mode with batch commands entered via the Tools/Batch Editor in GiveWin. The tutorial on batch usage in the book is rather brief (only two pages) and could perhaps have been extended a little for the generation of users who are not so familiar with command driven software. The four reference pages on the PcGive batch language at the back of the book are easy enough to interpret for someone with programming experience, but would be quite challenging for beginners.
My overall verdict on the new version of this package is that the changes which have been made so that it runs under Windows have significantly improved the operation of the program. The dialog boxes make the program easy to use and the graphics output, always a strong feature of PcGive, is now quite excellent. The restructuring of the package, separating the GiveWin interface from the program modules, causes no difficulties for program users but offers advantages to those wishing to develop their own procedures using Ox.
References
Hendry D F and Doornik J A (1996) Empirical Econometric Modelling Using PcGive 9.0 for Windows. London: International Thomson Business Press.Judge G and Harris R I D H (1995) PcGive Professional 8.0 and PcGive Student 8.0, The Economic Journal Vol 105 No430 pp 776-786.
Kenc T and Orszag J M (1997) Ox: An Object-Oriented Matrix Language, The Economic Journal Vol 107 No 440 pp 256-259.
Thomas R L (1997) Modern Econometrics: An Introduction. Harlow: Addison-Wesley.
Availability
In North America contact Elizabeth Goldman:Tel(617) 4234210 or (617) 3488179, Fax (617) 4234325, or write to ITBP, 20 Park Plaza, 14th Floor, Boston, MA 02116, USA.For the Rest of the World contact Jacqui Baldwin: Tel +44 (0) 171 4971422, Fax +44 (0) 171 4971426, e-mail Jacqui.Baldwin@itpuk.co.uk, or write to Corporate Special Sales, International Thomson Sales, 2-6 Boundary Row, London SE1 8HN, United Kingdom.
Prices for the full PcGive Professional 9.0 package (GiveWin+PcGive+PcFiml+Ox) depend on the number of users. There is an educational discount of about one third off the commercial price.

