Volume 10, Issue 1, 1996

Exploring Probability
and
Statistics with Spreadsheets
Callender, J.T. and R. Jackson
Prentice Hall 1995, £15.95, pp. viii + 236
This short book is an introduction to statistics and probability in fourteen chapters designed for first-year students in engineering, science, and business studies. The level of the book is elementary and is suitable for students whose mathematical training at university level may amount to a single semester of algebra and calculus. The novelty of the book is that its examples and exercises involve the use of spreadsheets.
The views of the authors are clearly expressed in the Preface:
"The approach to the teaching of statistics has changed significantly over recent years from a mathematical to a data-oriented approach using real data sets. This has often involved the use of software packages, such as Minitab, SAS, Stratgraphics, etc., to assist in the handling of the data. It is the view of the authors that dedicated statistical software packages, where the analysis is semi-automatic, are unsuitable for teaching statistics. However, with spreadsheets this is not the case; the user has to set up the analysis. In addition, the easy to use graphical facilities are an excellent aid to learning, giving an intuitive grasp of difficult concepts. Furthermore, the use of spreadsheets is widely recognised as a professional communication skill in science, engineering and business."This seems exactly right, with the qualification that students taking a further course in probability and statistics are then able to begin the transition to dedicated statistical software.
Apart from a brief introductory chapter, the book does not attempt to instruct readers on how to use a particular spreadsheet to obtain a particular result. While views may differ on this matter, I think that the excellent "coaches", "experts", "examples and demos", tutorials and help files provided by the best spreadsheets justify this approach. In addition, large numbers of non-academic spreadsheet users seem to design excellent spreadsheet applications without much further instruction than this. While the book can be used with any spreadsheet, the presentation is best suited to a Windows-based spreadsheet, and in practice, after the first chapter, the authors refer explicitly to Microsoft Excel for Windows.
The book’s next nine chapters treat graphical presentation of data, measures of central tendency and of dispersion, frequency distributions, probability distributions, the binomial and Poisson distributions, applications of the binomial and Poisson, the uniform, exponential and normal distributions, and the central limit theorem. In the last third of the book, four chapters deal with statistical process control, confidence intervals and test of significance (including goodness of fit), regression analysis, and the analysis of variance.
The style of writing is clear and cool, and the spreadsheet approach means that algebraic expressions are presented sparingly than is usual. For example, formulas are given for probability distributions (though not for the t or the F), but normal equations for regression do not appear. Integrals appear, but only informally. Each chapter contains perhaps a dozen applied examples and half a dozen solved exercises on the average. The book is quite suitable for self study, and could also be given in one semester to a first-year audience with a one-semester background in mathematics

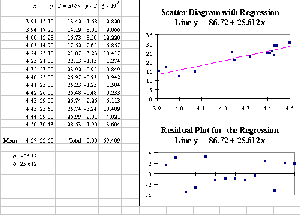
The level which the book reaches is indicated by the adjacent screen shot based on Table 13.7 and Figures 13.8-13.9. Given raw data x and y a linear fit is defined in terms of parameters a and b. The parameter a is defined in terms of b, and of the means of x and y, so that the residuals will sum to 0. Finally, Microsoft Excel Solver is used to minimised the sum of squared residuals in terms of b, with the displayed results and plots. Curiously and untypically, the text on pp. 200-201 disagrees slightly w ith the above, perhaps because of data revision or incomplete optimisation.
The book’s aims are deliberately modest. Accepting this, it can be said that in class-room use a larger selection of exercises would be desirable. Two welcome additions would be a supplementary data diskette and a short section about obtaining economic and business data on the Internet.
There is plenty of scope for more advanced works making fuller use of spreadsheet optimisation, statistical, and data analysis tools in science, engineering and business studies. This book shows the way at an elementary level and is thoroughly to be recommended, either for introductory teaching to general students, or for self-study at that level.
Barry Murphy
Department of Economics, University of Portsmouth

