


Graphs have always played a fundamental role in teaching micro-economics. Experience has shown, for example, that first year students get a better grasp of the impact of monopoly price setting when a diagram is used.
There is however a shortcoming with the graphs that appear in textbooks: Curves appear to be static. There is a danger that students lose track of the complex interdependencies typical to many micro-economic models. Lecturers have to make students aware of the fact that curves in diagrams (positions and slopes) as well as equilibria are crucially dependent upon specific parameter values and the other relevant variables in the models. Computers can be used to assist in this task.
MicroSIM is a package of EXCEL-based spreadsheets that explains basic micro-economic theory. The program's first version became available to students at the University of Maastricht in the autumn of 1995. It has been used both as a tool in lectures and as an aid for personal study.
All simulations in MicroSIM share the same basic structure: Parameter values can be altered, a graph of the model is drawn, and numerical results are presented. The effect of changing one or more model parameters can be seen immediately, since the diagram and the numerical outcomes change accordingly. Some of the simulations feature buttons which perform special functions. To provide an idea of the possibilities of MicroSIM, a number of examples are presented. Four of the thirteen available models have been selected for the purpose.
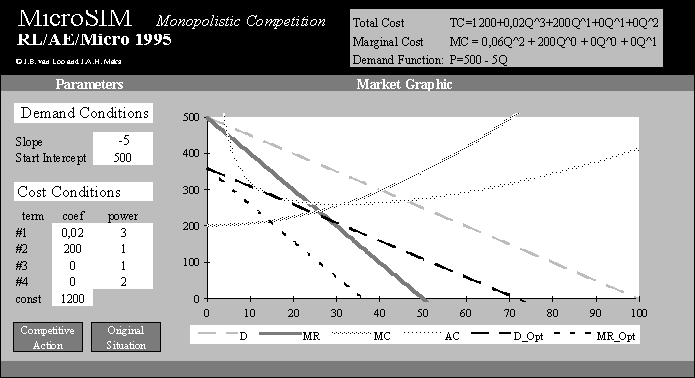
The theory of Chamberlinian monopolistic competition has become increasingly influential in many branches of modern economics. The basic argument is illustrated in one of the MicroSIM simulations.
The three essential elements of monopolistically competitive markets, market power, falling average costs, and closely substitutable products, are apparent in the diagram. Parameter values of the demand and cost functions can be changed by the user. The parameters "Slope" and "Intercept" determine the demand curve (D) and the marginal revenue curve (MR). The cost structure is determined by the parameters of the total cost function. MicroSIM automatically calculates the corresponding average and marginal cost functions (AC and MC).
In a monopolistically competitive industry, profits can not exist in a long run equilibrium: New firms will enter the market with only marginally different products substituting for older ones. This process continues until profits for each firm in the industry are zero (average costs equal the market price). In the diagram, this is where the demand curve (D_OPT) becomes tangent to the average cost function.
The dynamic process from a profit to a zero-profit situation can be simulated by clicking on the "Competitive Action" button in the program. This gradually moves the original demand (D) and marginal revenue (MR) curves to the zero-profit equilibrium, where they coincide with D_OPT and MR_OPT. Clicking on "Original Situation" shifts D and MR back to their initial position.
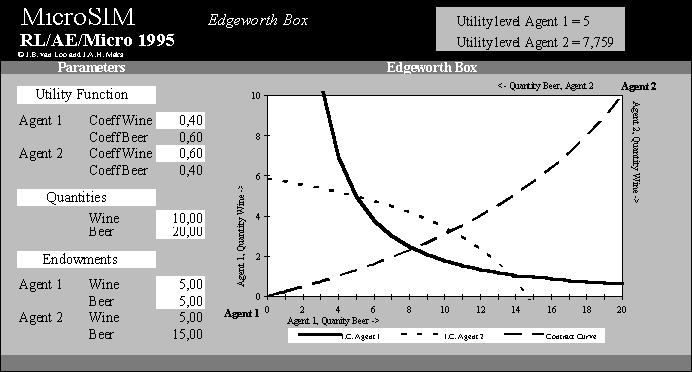
The idea of allocative efficiency can easily be illustrated in an Edgeworth box. In MicroSIM, an example of beverage consumption is used. Two individuals (Agent 1 and Agent 2) are endowed with quantities of wine and beer. The parameter values of the Cobb-Douglas utility function, the total quantities available, and the individuals' endowments can be changed by the user.
The program draws an indifference curve of both agents through the initial [beer, wine] endowment. As is widely known, mutually benificial trade is possible as long as the contract curve in the lense has not yet been reached.
An advantage of the computer simulation of the Edgeworth box as compared with the standard textbook diagrams is that it becomes immediately apparent that the curvature of the contract curve is dependent upon the values of the parameters of the (Cobb-Douglas) utility function.
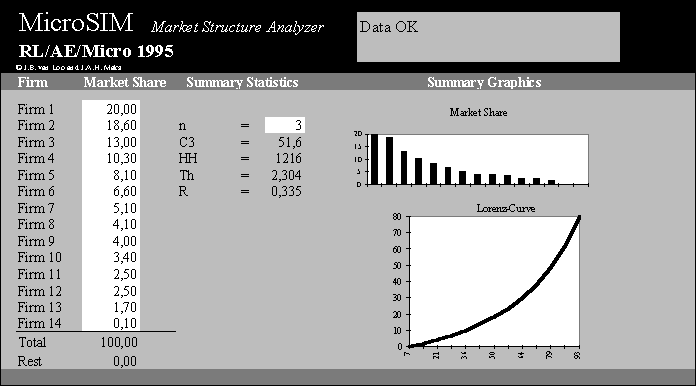
Investigation of market structures has traditionally been one of the core issues in micro-economics. To be able to judge the competitiveness of a market, certain measures provide useful insights.
The program "Market structure analyzer" (MSA) simplifies the task of calculating these measures. The idea is as follows: The user enters the market shares of a maximum of 14 firms. MSA then provides the following measures:
In addition to these numerical measures, two diagrams are presented. All individual market shares appear in the first one. The second diagram draws a Lorenz-Curve which enables a graphical evaluation of the (in)equality of the distribution.
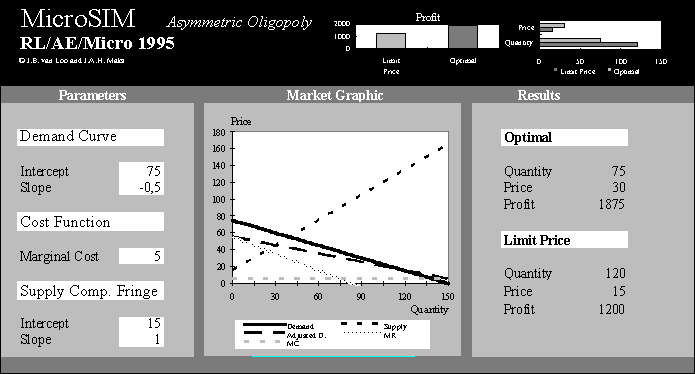
The competition between a dominant firm and a large number of
small competitive suppliers, the so-called "competitive fringe",
as described in Joe Bains' (1968) book, has become
standard in industrial economics. The interesting features of this model
are its strategic elements.
Essentially, the dominant firm has to decide whether to allow
the competitive suppliers to enter the market. If it does so,
its demand will be less, but the price charged can be high. The
optimal price is found by equating marginal cost (MC) to marginal
revenue (MR). If the other option is chosen, i.e. the dominant
firm deters the entry of competition, the price charged will have
to be lower. A price that leaves competitors indifferent about
entering a market is called a limit price.
In the MicroSIM simulation Asymmetric Oligopoly, dominant-firm-profits for equi-marginal-pricing (MR=MC) and limit-pricing are compared.
Due to the relative complexity of the model, the individual curves
deserve some separate attention. The marginal cost function of
the dominant firm (MC) is assumed to be constant. As the competitive
fringe experiences decreasing returns to scale, the marginal cost
curve (Supply) is upward sloping.
Turning to the demand side of the market, the demand curve that
the dominant firm faces in the absence of a competitive fringe
is "demand" in figure 4. When there are other players
in the market, they will supply products as long as the prevailing
market price is above their reservation supply price. In this
situation, demand for the dominant firm will be less, and the
relevant demand curve becomes "Adjusted D".
The central result can be illustrated by using the numerical example in the simulation. When the dominant firm sets a limit price of 15, 120 units will be sold. Profits will be (P-MC)*Q = (15-5)*120 = 1200. In the case of equi-marginal pricing, the optimal price is 30. In this case, the dominant firm and the competitive fringe share the market. The fringe sells 15 units, the dominant firm 75. The latter firms' profits are then (30-5)*75 = 1875. It becomes evident that limit pricing decreases profits by a considerable amount.
The preceding examples have shown that computer simulations can
contribute significantly to introductory micro-economics courses.
During lectures, MicroSIM facilitates the instructors' task in
that he/she is able to perform comparative statics by just changing
a couple of parameter values. Students can also benefit from using
MicroSIM as a supplement to their textbooks.
In the future, a new version of MicroSIM will be developed to deal with more complicated problems. In addition, an interactive version of the programme would help to make skills training sessions more effective. The idea is that MicroSIM presents the student with a problem. To move on to the next level, the student enters an answer in the simulation. The computer then determines whether the answer is correct and provides immediate feedback. A small step in this direction has already been made. In the test program MicroEXT, where consumer behaviour is analyzed, students answer questions about budget constraints, prices, and utility functions.
Bain J (1968) Industrial Organization, 2nd Edition, John Wiley & Sons, Inc. New York/London/Sydney.
Notes: The authors thank Sarah Lynne Jones for her useful comments on their English.
They may be contacted at the following address: Rijksuniversiteit Limburg, Faculty of Economics and Business Administration, P.O. Box 16, Maastricht, The Netherlands ; e-mail j.vanloo@roa.unimaas.nl or h.maks@algec.unimaas.nl